Hi friends,
Happy Monday! The latest MacroVisor Dashboard is now available, with updates on a variety of asset classes around the world.
Announcement
In case you missed last week’s Global Outlook for Q2 2024, here it is on our YouTube. We welcome your feedback and questions!
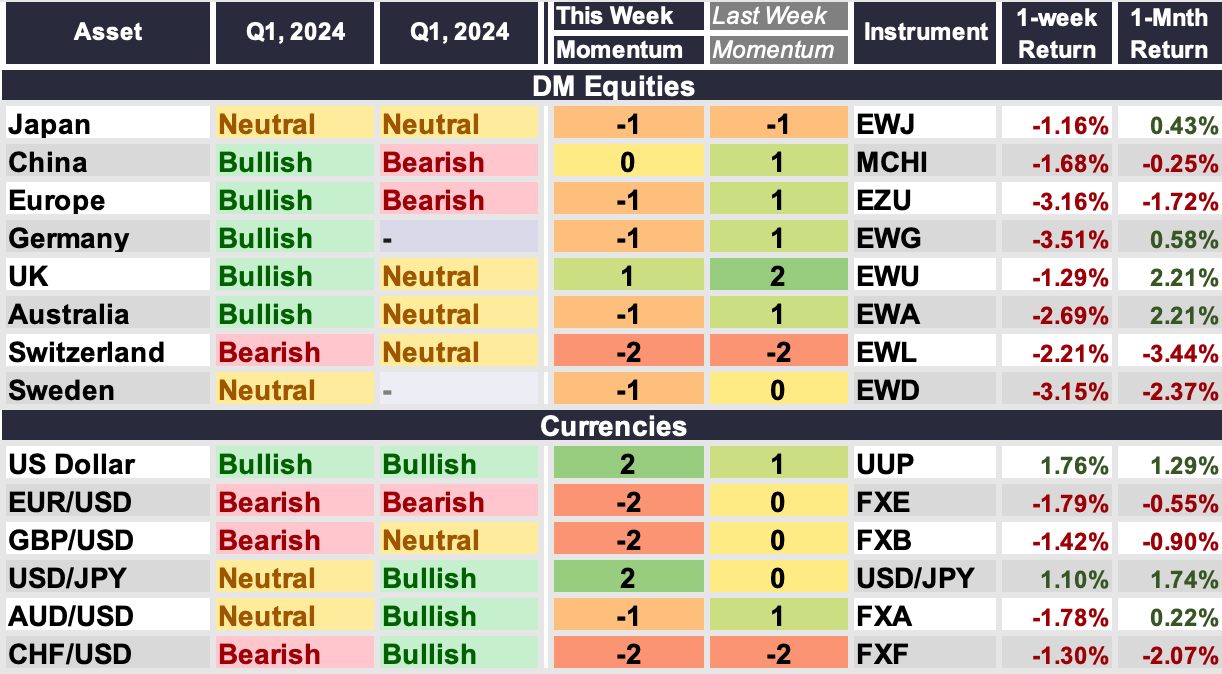
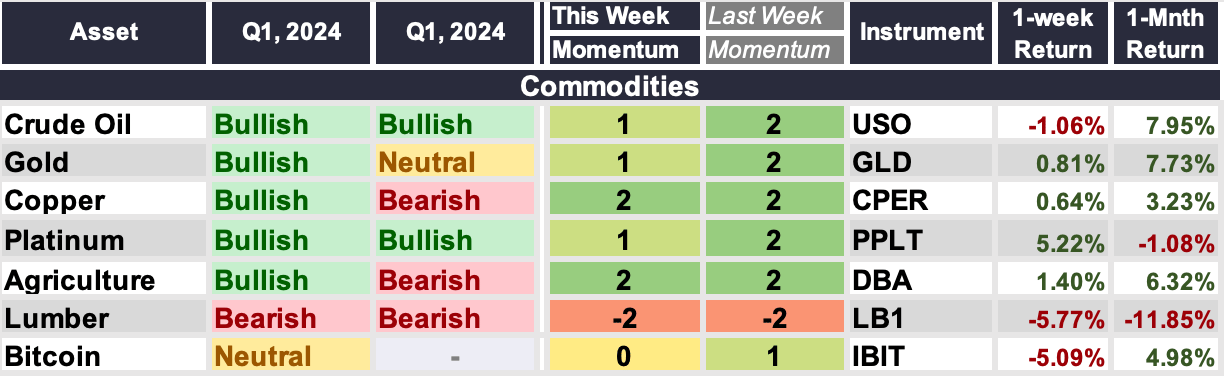
Here’s how the MacroVisor Dashboard displays our analysis:
Asset Name
Macro: This Quarter’s Macro Score
Macro: Previous Quarter’s Macro Score
Momentum: This Week’s Momentum Score
Momentum: Previous Week’s Momentum Score
Trading Instrument
1-Week Return
1-Month Return
Please make sure to also follow our Breakfast Bites articles where we report on relevant data to keep you updated alongside our weekly dashboard.
There is a key at the bottom of this post that tells you what we’ve considered when putting together this dashboard.

Scoring
3 is our highest positive momentum score, when everything suggests strong upward momentum that is likely to continue. We are more aggressive in accumulating during a score this high.
2 is our second highest positive momentum score, where buyers are in favor and we are likely to continue to build into positions if we are just starting them.
1 is our lowest positive momentum score, where buyers still enjoy a tactical advantage, but our conviction is not as high as momentum is not as strong and risks may exist.
0 is our neutral momentum score, where we would want to neither have longs or shorts in the short-term.
-1 is our lowest conviction negative momentum score, where we could start building a short position or exiting a long we held previously, but where we would not be aggressive.
-2 is our second-highest conviction negative momentum score, where we would be looking at building short positions or fully exiting longs.
-3 is our highest conviction negative momentum score, where we would be interested in more aggressive short positioning.
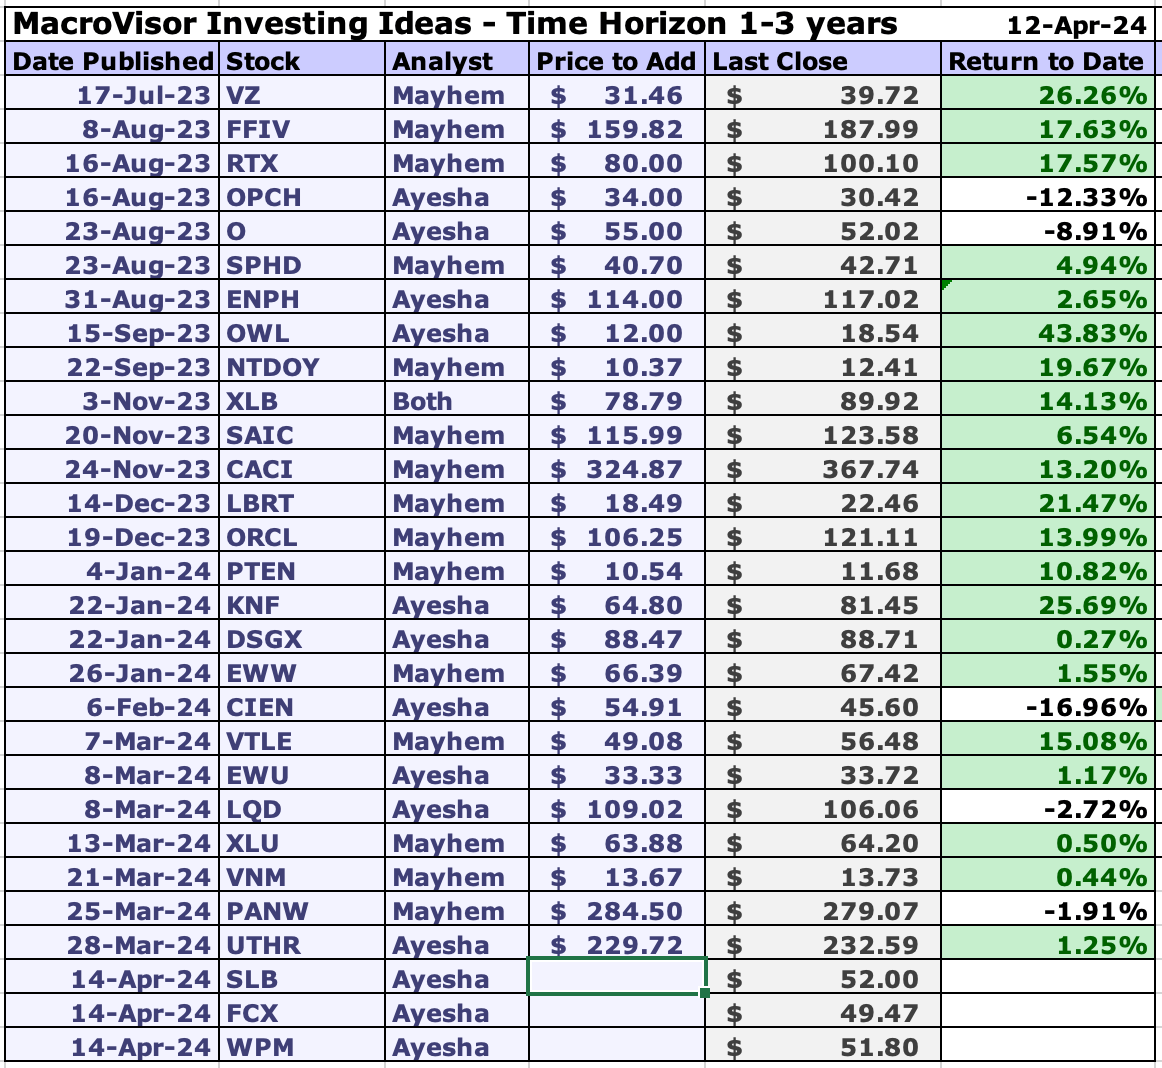
The MacroVisor Investing Portfolio
Our Notes for the Week Ahead
United States
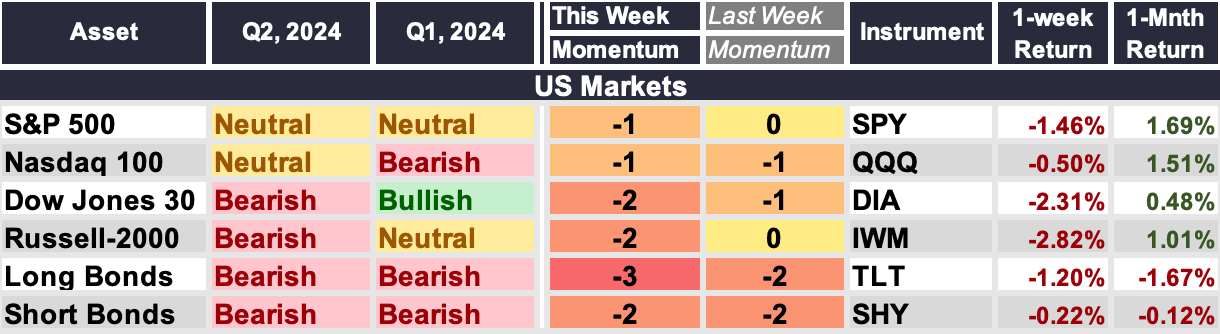
S&P 500, NASDAQ 100, Dow Jones 30, Russell 2000
US equity markets fell again last week, with selling pressure amplified by resurgent inflationary concerns, rising rates, geopolitical tensions and further shifting of the market view on Fed policy, with the number of cuts this year expected to be just 1.5 per Fed Funds Futures.
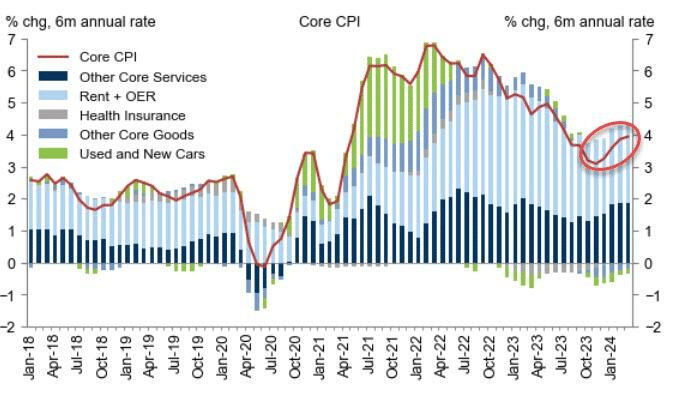
Source: Goldman Sachs
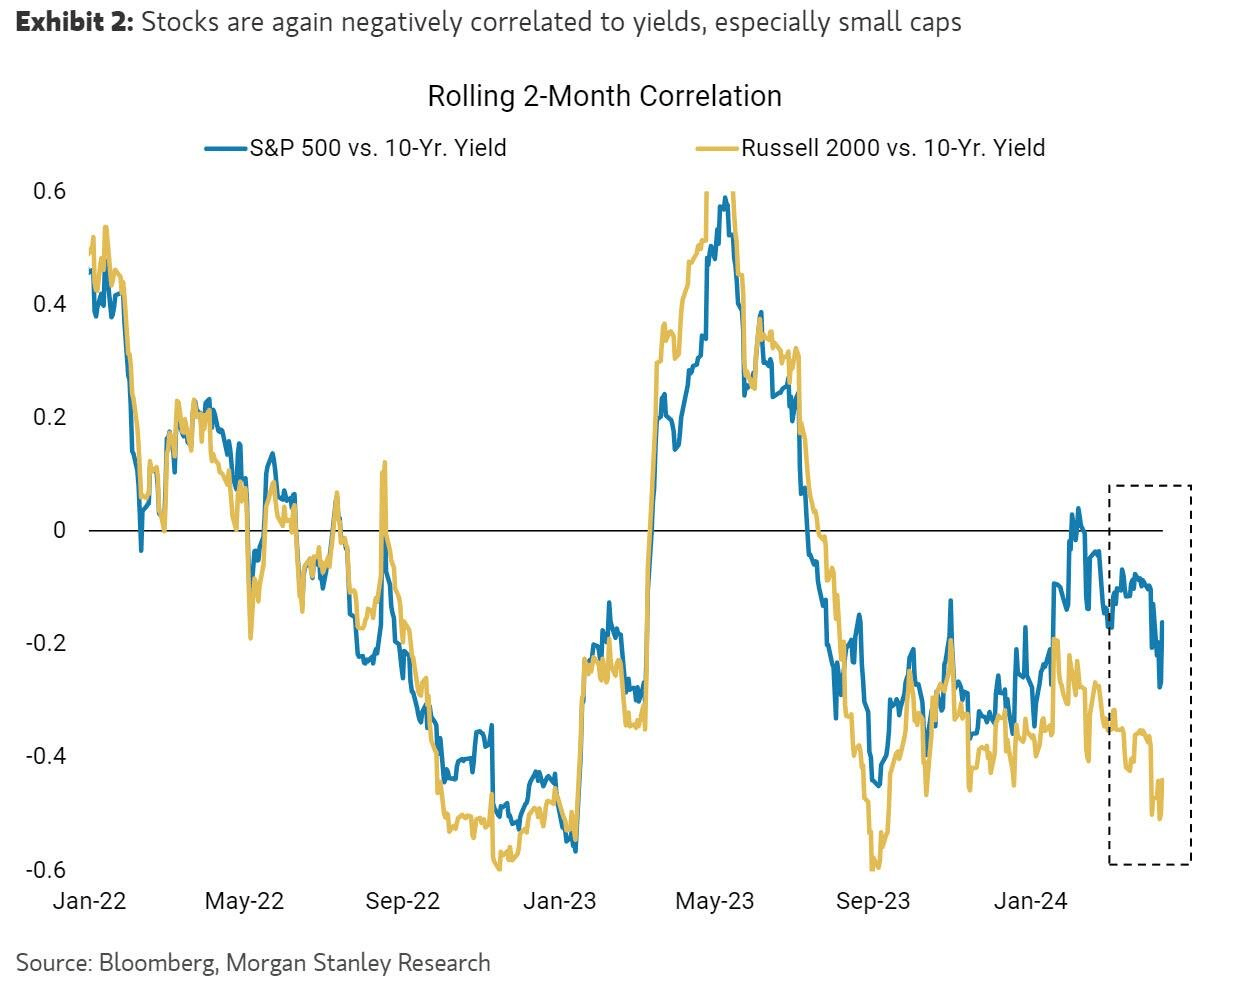
Concerns about inflation are driving rates higher to such an extent that equities cannot ignore them, particularly small caps, where about 40% of the Russell 2000 is unprofitable and then regional banks are also quite rate sensitive, particularly on the longer end.
The S&P 500 fell through its 20-day moving average, after falling below its uptrend line the prior week. Sellers have a solid technical advantage in the short-term.
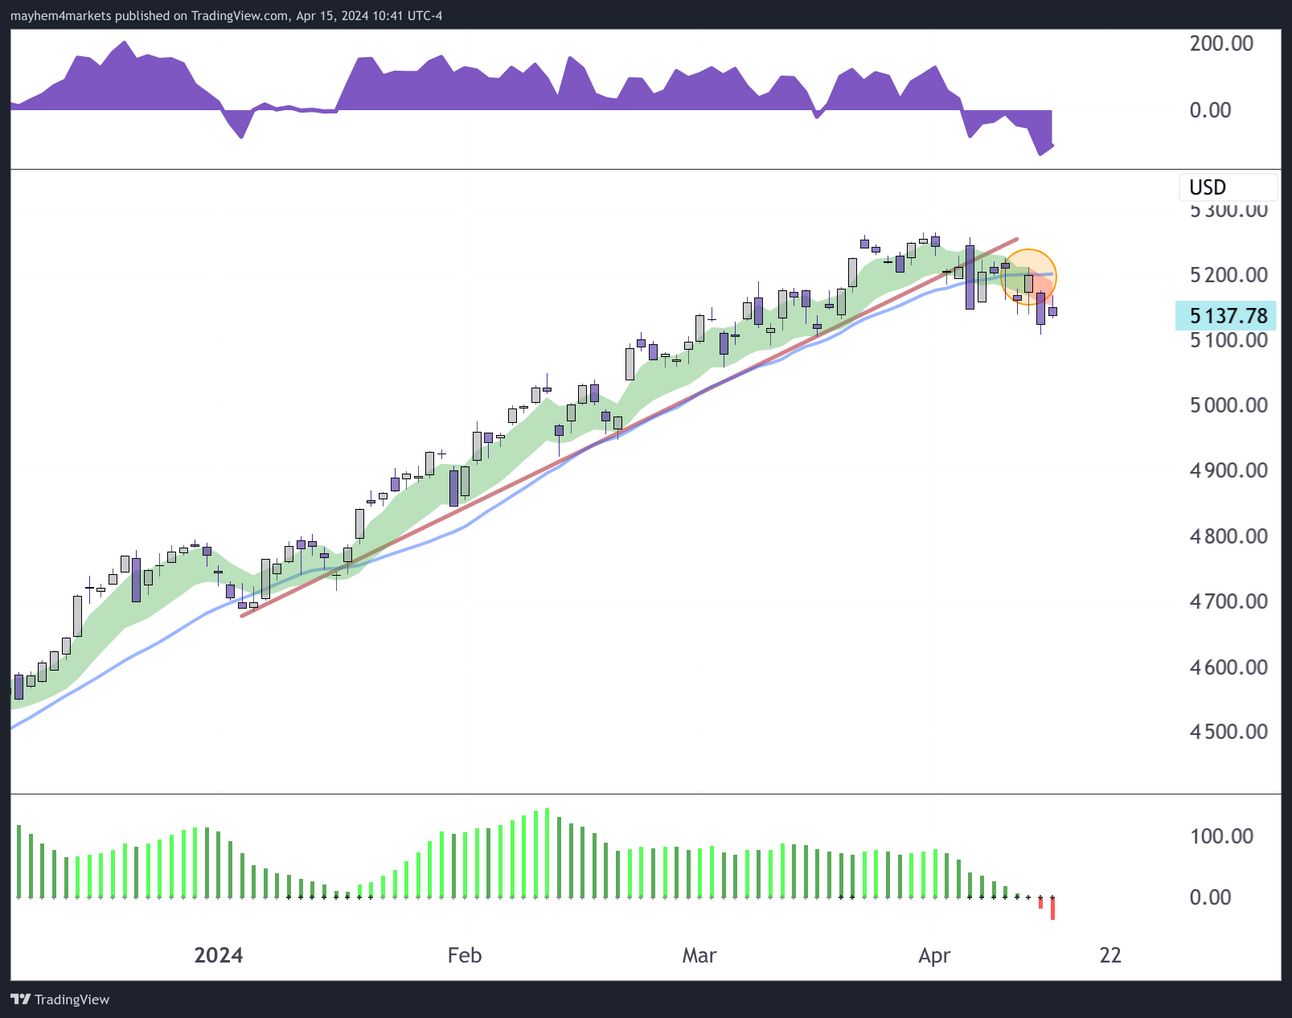
SPX 5200 was taken out decisively last week as we fell below the 20-day moving average. Bringing into view 5,150 and 5,100 as potential areas of options-implied support and magnetism for price. Below 5,100 we have the largest area of full options chain positioning at 5,000.
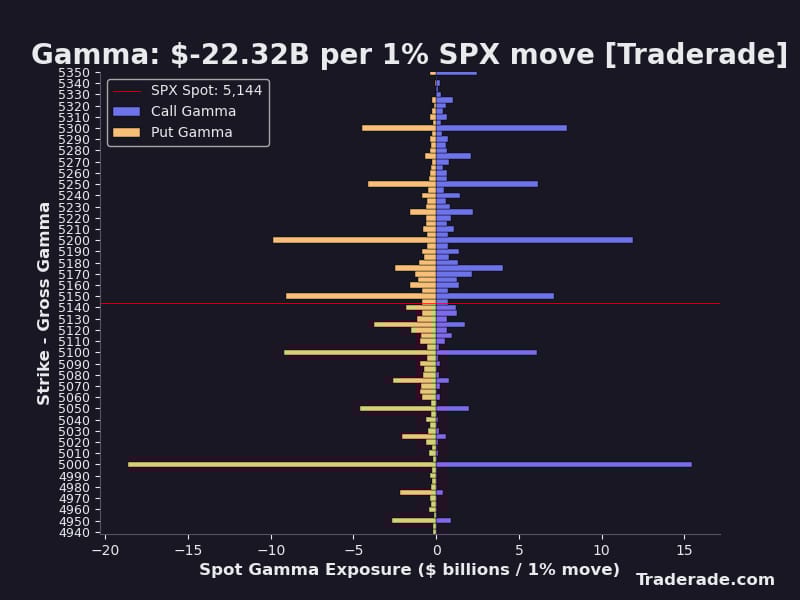
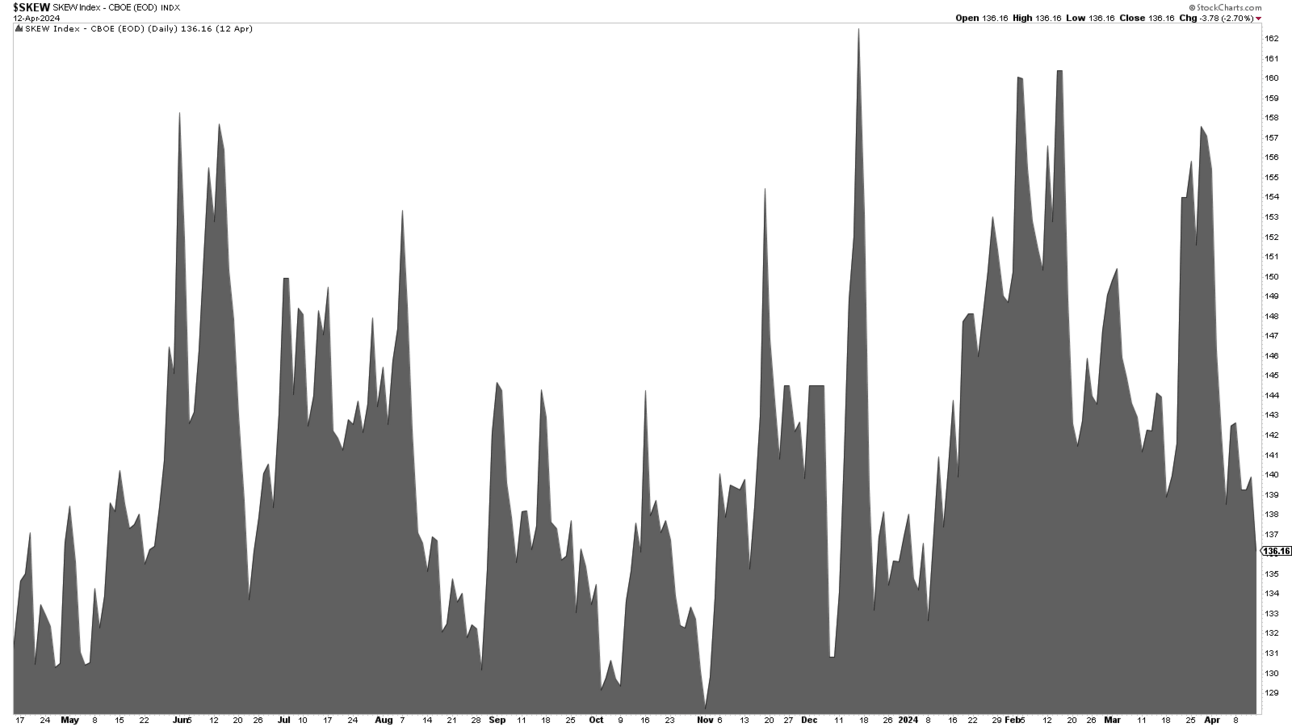
Skew still remains low, dropping from last week. Because we are in monthly options expiration week, the supportive Vanna and Charm flows that come from decaying SPX put options will be subdued as overall put exposure remains low.
The largest source of inflows, share buybacks, are also on hold as we enter peak earnings season. This could provide additional potential for sellers to take advantage of this precariously positioned market.

Chart: Goldman Sachs
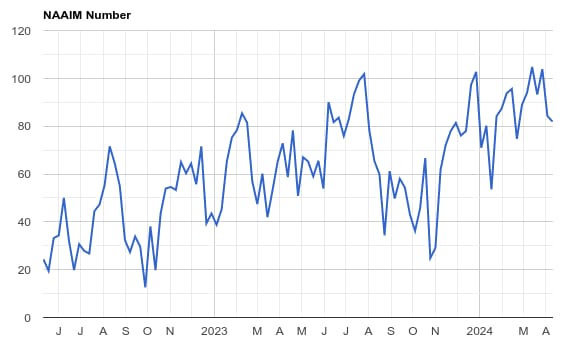
Last week money managers modestly decreased long positioning, but still remain quite long as of Thursday’s survey data. We imagine this changed on Friday and we could see more distribution of positioning in this week’s survey.
One other tail risk for US equities is CTA positioning, which has been rather elevated. A drawdown below SPX 5079 could cause a rather significant increase in selling pressure from these funds, according to BofA.
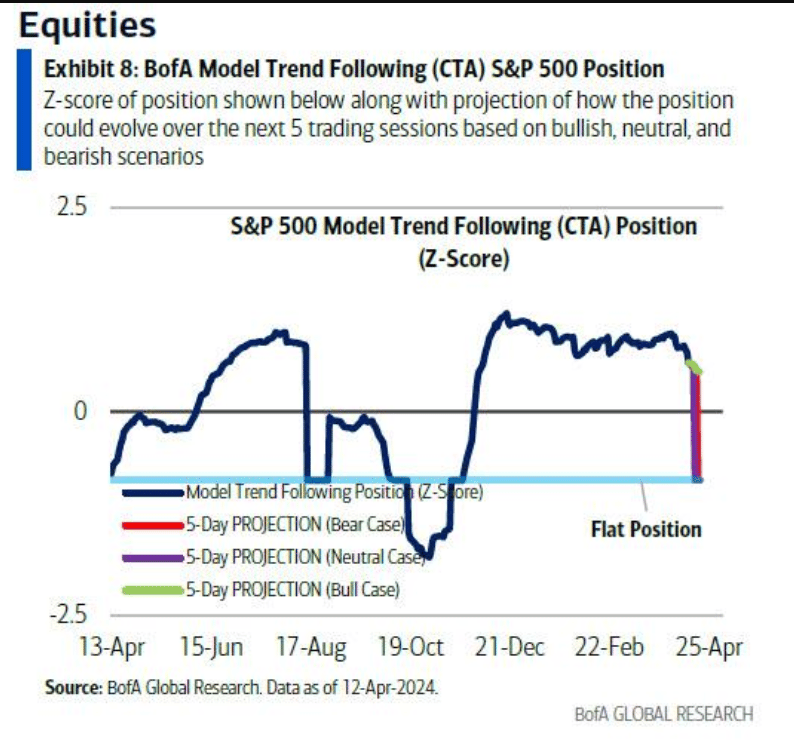
As a result, we believe that the US equity market is at a major inflection point, and runs a heightened risk of a correction in price. The Dow and Russell 2000 look the weakest of the major indices, but all of them are showing signs of increasingly negative momentum. We would look at 4,800 on the S&P 500 as a potential downside area of support should the correction play out.
The Dollar, Long, and Short Duration Treasuries
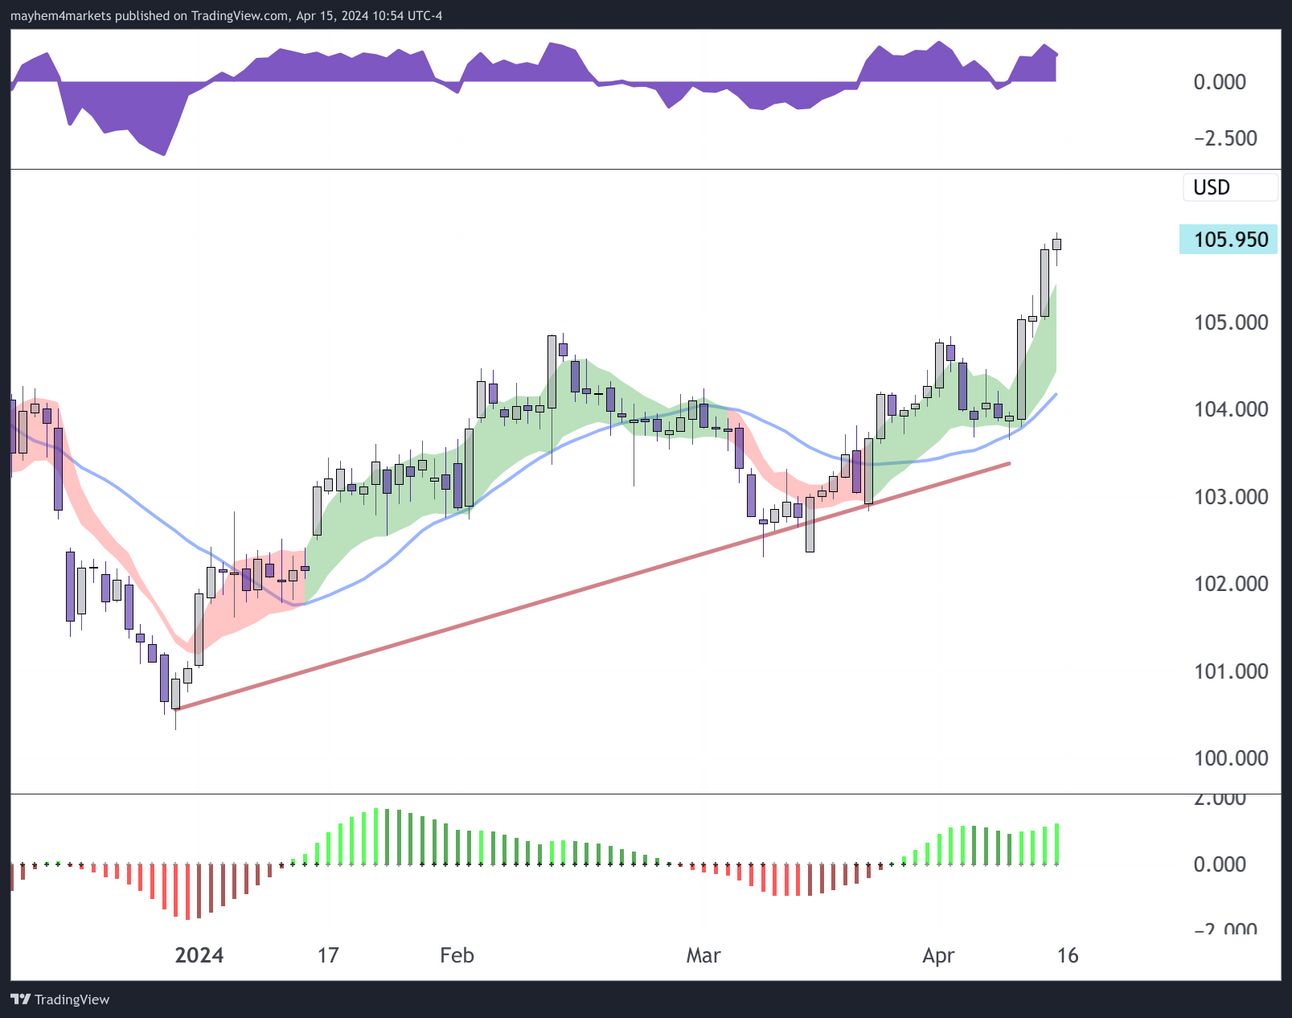
Rising rates and geopolitical tensions sent the dollar surging last week. We continue to believe that the dollar has upside from here due to a convergence of factors that include those same which are putting pressure on US equities: re-accelerating inflation, rising rates, hawkish Fedspeak and adding to that, the ECB cooing more dovishly, suggesting that cuts could come as early as June.
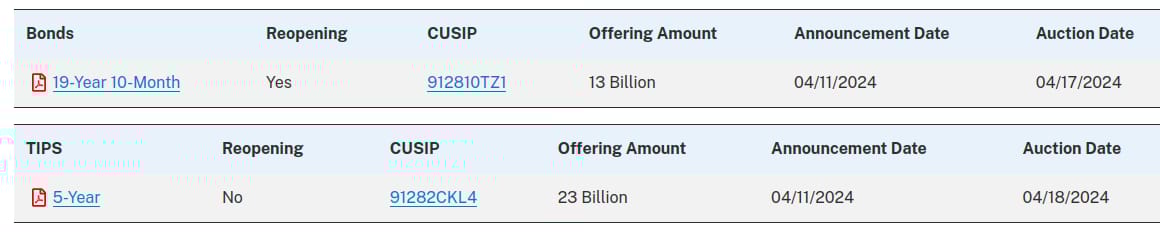
Treasury auctions are quieter this week, with a 20-year bond auction and 5-year TIPS auction taking center stage on Wednesday and Thursday for of US sovereign debt $36B on offer. We don’t foresee these auctions as being major market movers unless there are outlier events (much weaker or stronger than expected demand, with the former being a left tail risk for equities and the price of sovereign duration).
30-year bond futures continued their descent last week, as the US government debt market was rocked by a hotter than expected CPI print.
There remains no term premium to incentivize investors to increase long-end exposure here, meaning that long-end rates are not paying more than short-end rates, yet buying longer duration exposure comes with heightened risks due to the commitment of capital over a longer time horizon.
Unless and until this changes, we remain cautious of long duration exposure, preferring Treasury bills that not only pay better, but also keep cash locked up for a much shorter time period.
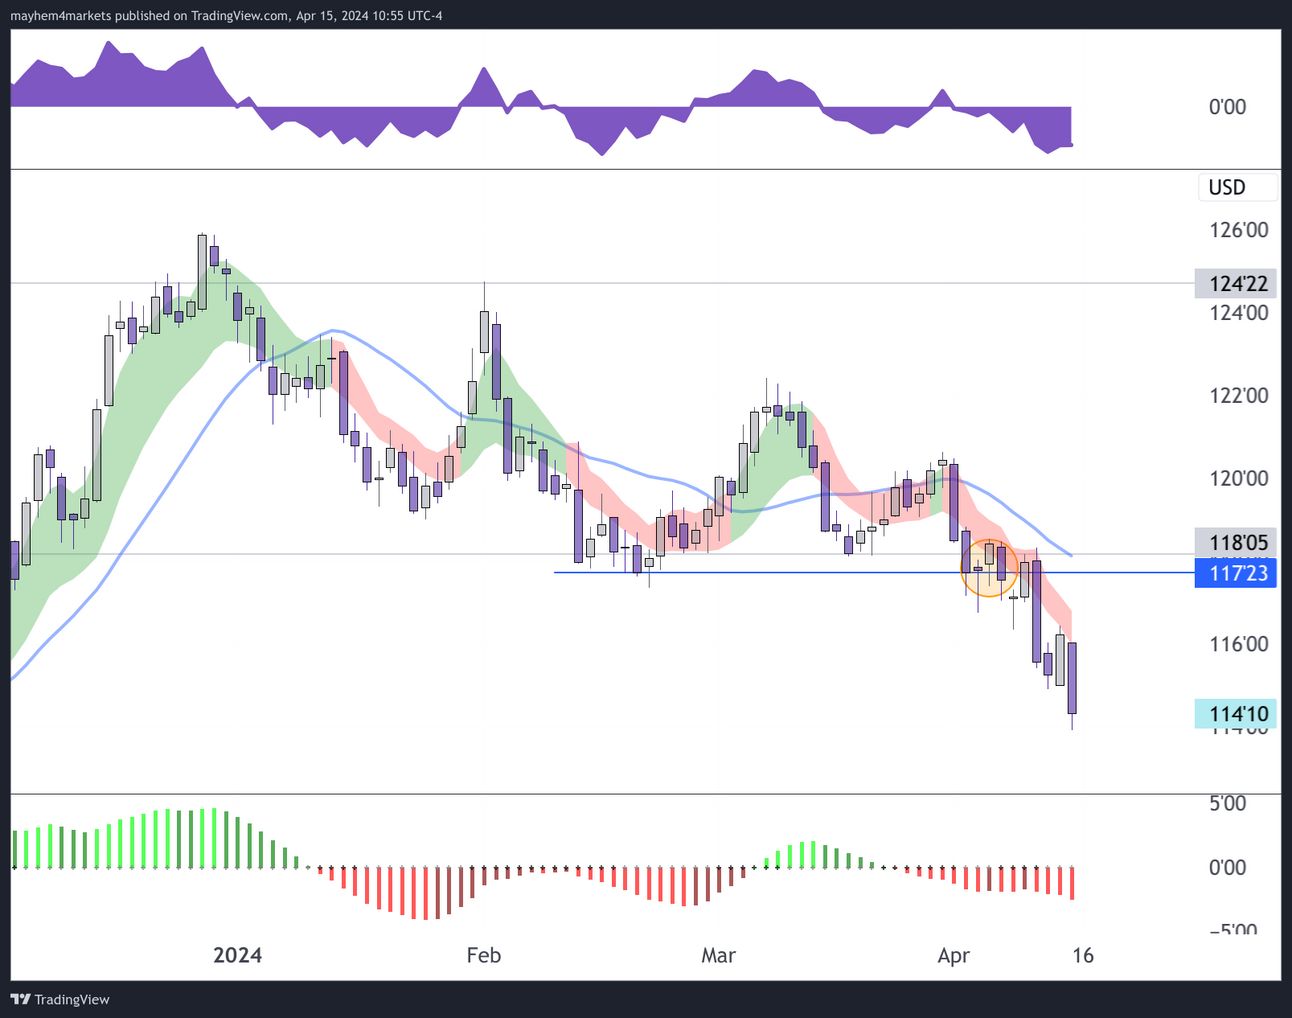
We believe that last week’s price action was rather decisive, with Treasuries slipping and the dollar rallying. Both trends seem set to continue, and we remain cautious of 2s and 30s, and bullish of the US dollar as a result.
Developed Markets
We remain cautious and vigilant on global equities this week and currencies due to a stronger dollar. Geopolitical tensions may have taken a pause today but, the situation continues to remain volatile and may impact global market pricing.
Japan & USD/JPY
The momentum in equities continues to remain lackluster, particularly with the JPY making new cycle lows. There were further discussions by the BoJ that inflation will no longer be such a major focus, which means the the BoJ can think about hiking again (which we don’t see this quarter) but also that they can start to tighten their bond buying policies, which should reduce liquidity and weigh on equities. Japan is set to report inflation data on Thursday (Friday morning in Asia) and a weaker report may see equities catch a bid.
China
Chinese equities opened higher today even though most markets were under pressure because there is discussion that the PBoC may inject liquidity. However, until that actually happens, momentum is stalling here. Monday we have the Q1 GDP, retail sales and industrial production being released (Tue morning in Asia). Over the weekend, they will release the main borrowing rate LPR (Loan Prime Rate). Analysts are expecting a cut and if that doesn’t happen we may see pressure on equities next week.
Europe & EUR/USD and Germany
European equities have come under pressure with geopolitical tensions. With the ECB behind us and priced in, attention will now be on earnings. 6% of the Stoxx600 reports this week. Momentum is signaling negative.
UK & GBP/USD
UK equities continue signal bullish momentum here. It’s a big week for UK data and I’d be cautious trading the market. We have Wages Data on Tuesday, Inflation data on Wednesday and Retail Sales data on Friday. Numbers coming in hotter than expected could put pressure on equities.
Australia & AUD/USD
Equities signaling negative momentum, in line with global equities. No major economic data to move the markets.
Switzerland & CHF/USD
Equities and the Swiss Franc continue to signal very negative momentum.
Sweden
Swedish equities have also turned negative.
Commodities
Crude Oil
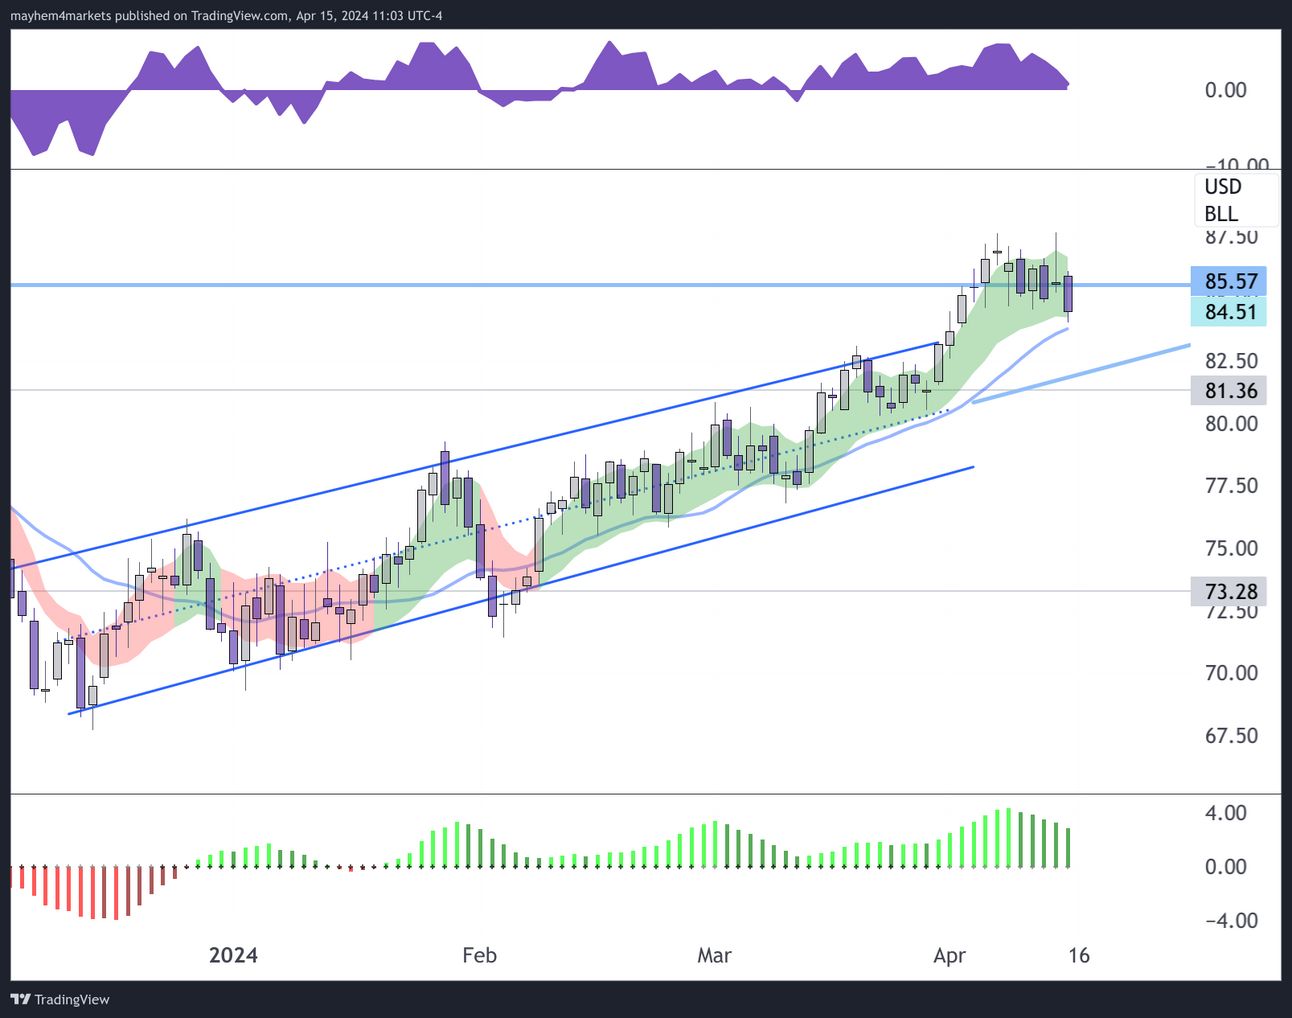
WTIC futures peaked last week at 87.67, before reversing lower from their highs. Geopolitical tensions and concerns about potential supply bottlenecks increased speculative appetites and upside price hedging pressure by market participants.
Despite oil’s recent slip, we continue to favor upside price action and believe that the combination of supply constraints, growing demand and geopolitical risks remaining elevated all could drive prices higher from here.
We remain bullish on oil and the key players in the space that we’ve shared our bullish view son.
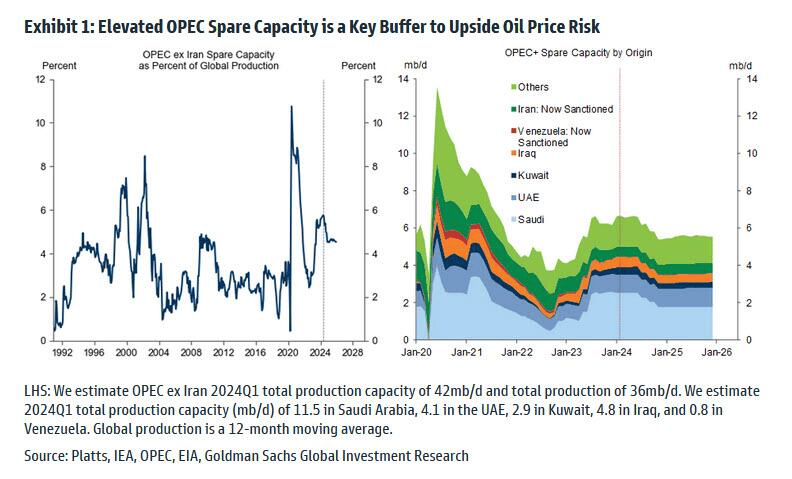
OPEC still has spare capacity they could unleash into any disruptive event that takes other capacity offline, which could help to buffer upside oil price risk to some degree depending on the scale and duration of any disruption to supply.
Hedge funds have been aggressively selling energy stocks into this rise in oil prices, which has us more bullish on the stocks than the commodity itself for now.

Gold
Like oil, gold peaked last week and then reversed from its highs, reaching a new intraday all-time high of 2448.8 on Friday. We remain bullish of gold here, though we do believe the metal could be due for a period of consolidation after such a violent rise if there are no more near-term catalysts.

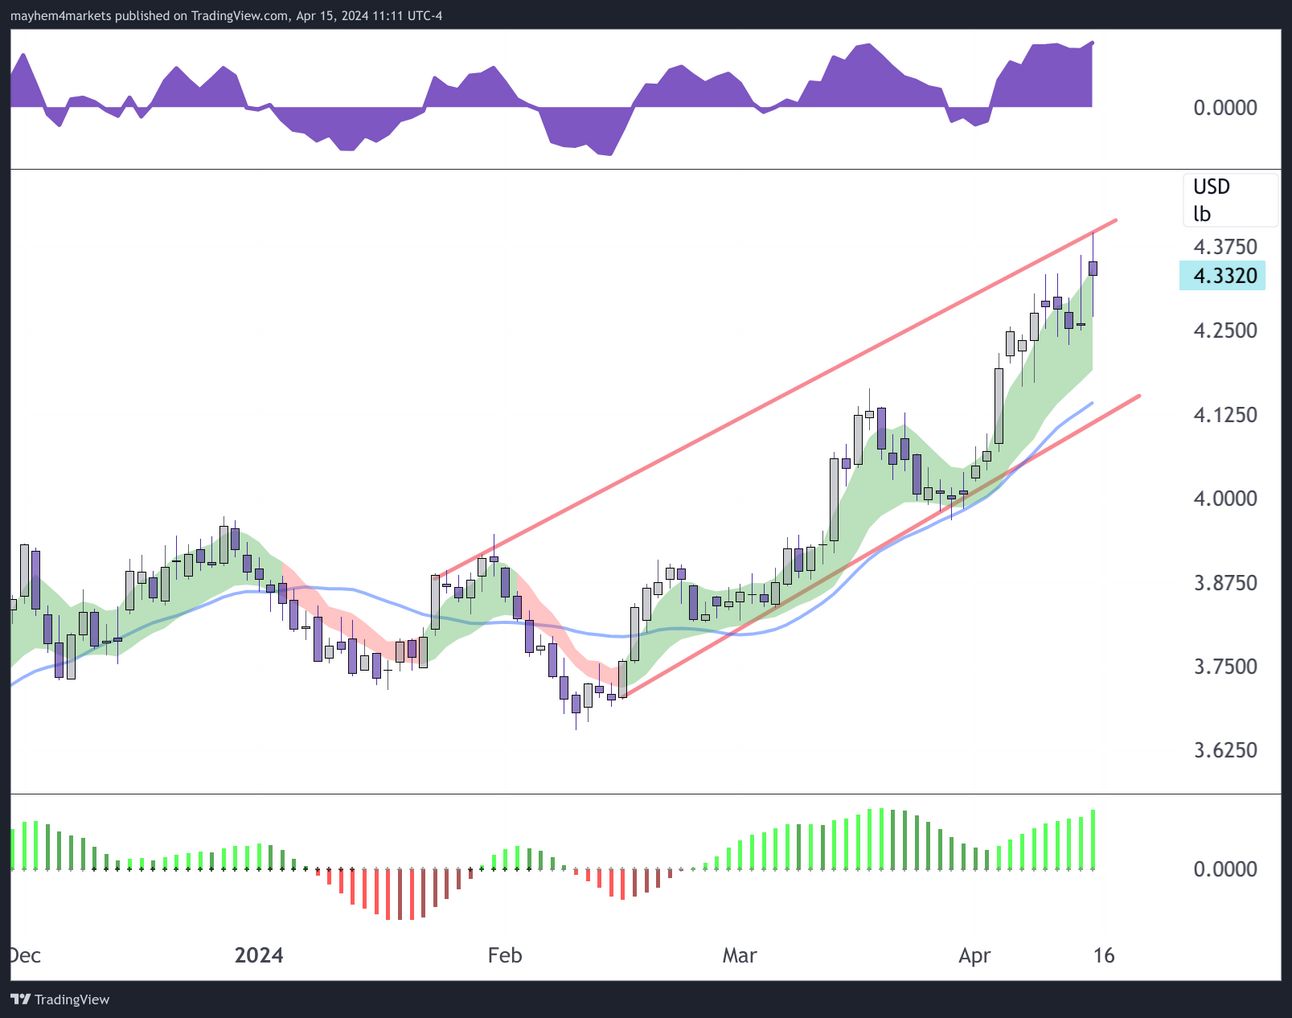
Copper
Copper is continuing to demonstrate impressive strength as we see demand for goods returning globally, with the AI boom creating a growing need for power generation and transmission, the latter of which involves a ton of, you guessed it, copper!
Supplies remain insufficient and exploration has been subdued for years, prompting any resurgence of demand to have the potential to push prices significantly higher, with $4.785 as a level we’re watching in the intermediate term as a potential supply zone that could offer resistance.
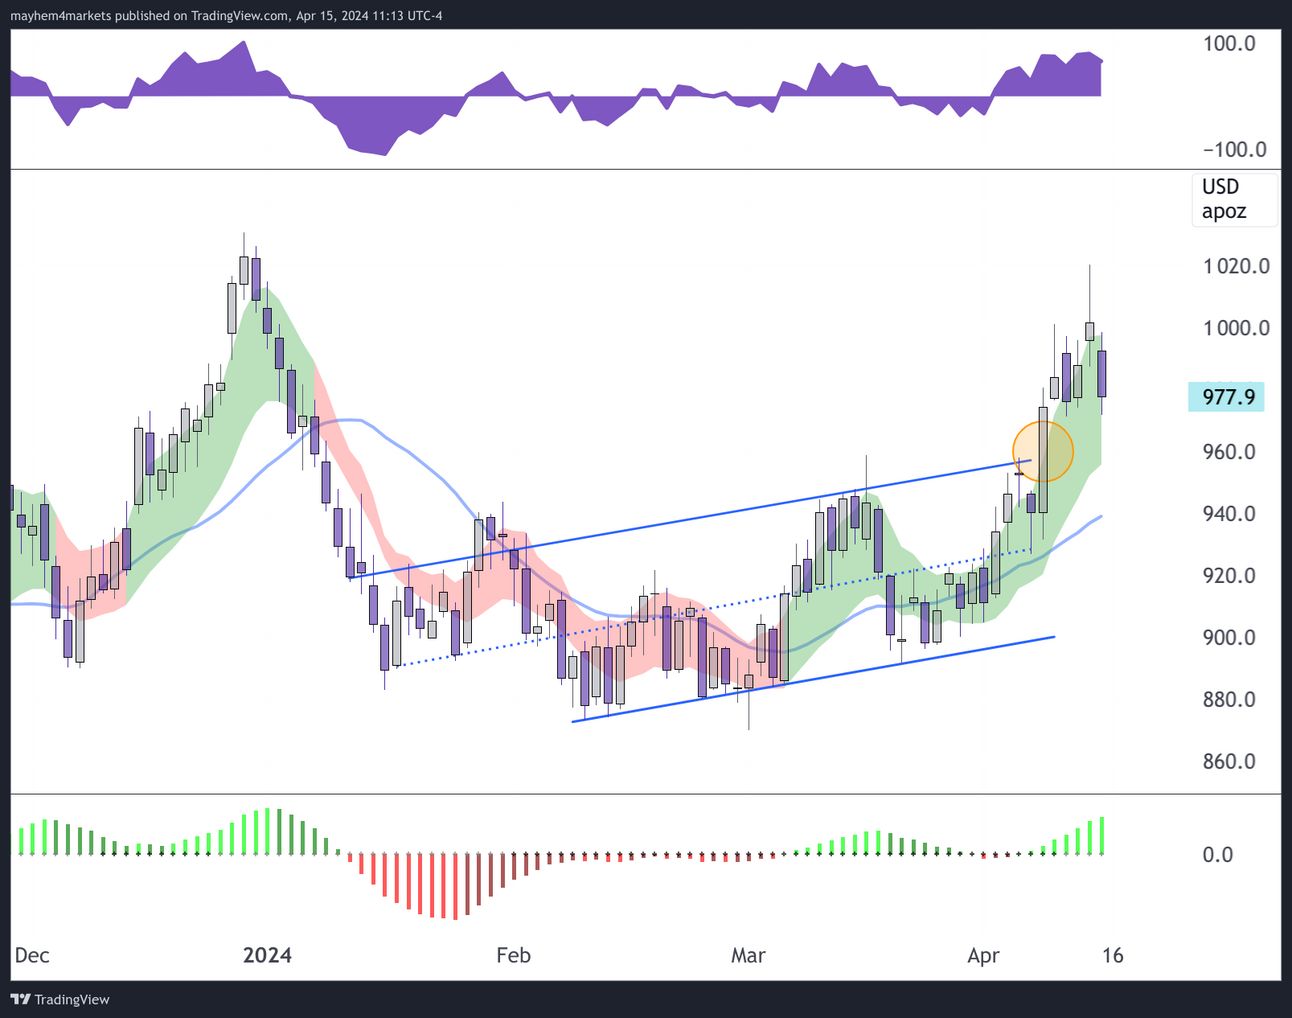
Platinum
Platinum is consolidating its recent gains but still appears to be in a constructive uptrend with room to move higher as we see industrial demand improving. We believe $1,022 may be an achievable upside level.
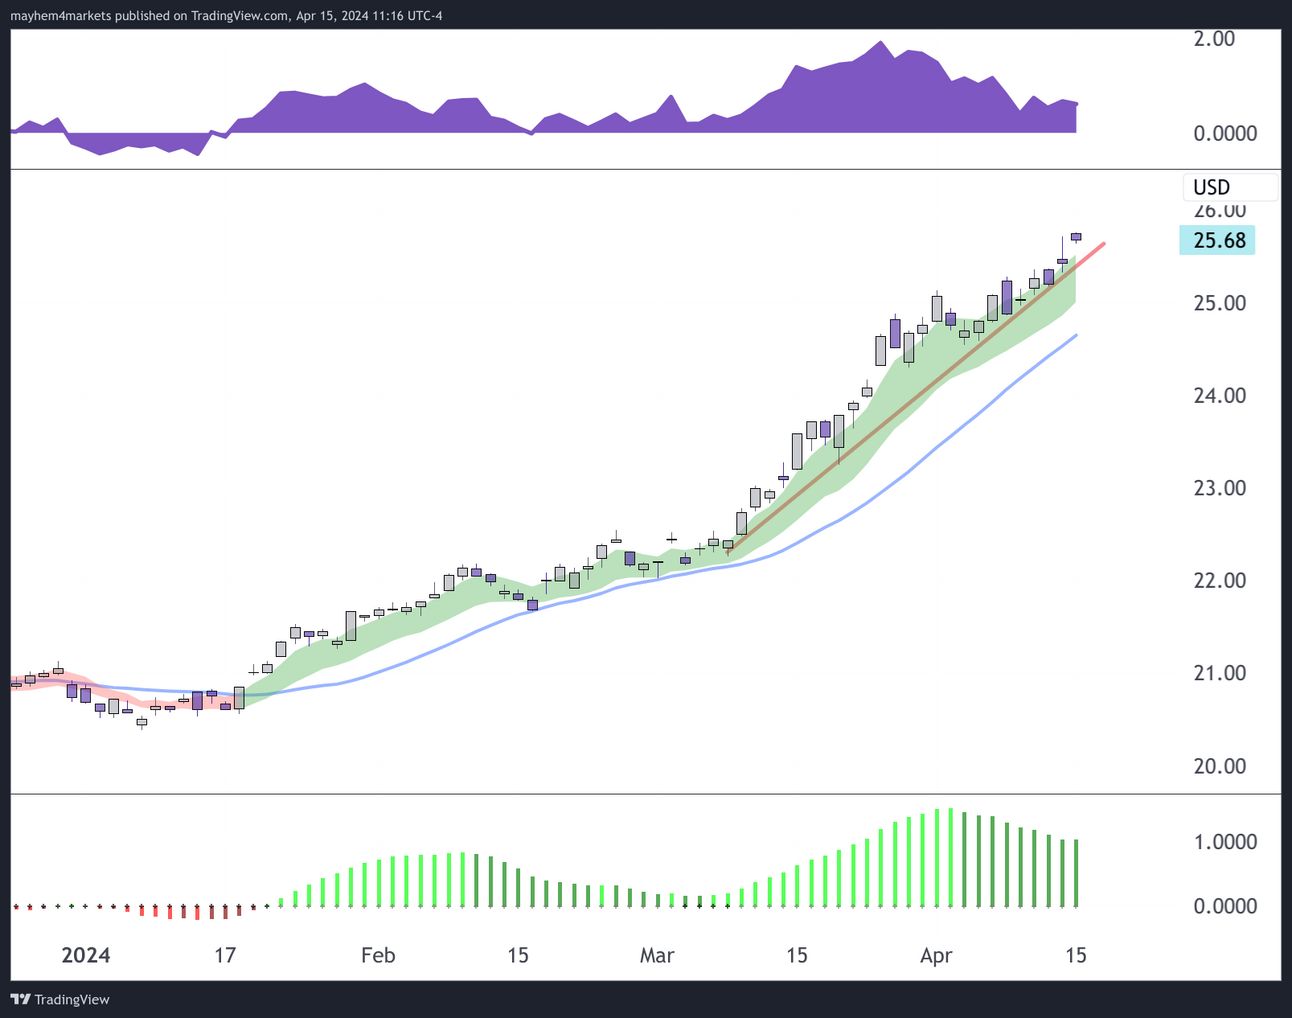
Agriculture
Ag is on the move again, breaking out of a short-term consolidation as we see softs surging, with cocoa hitting new all-time highs once again. The momentum here remains strong and we believe that further upside is on the horizon.
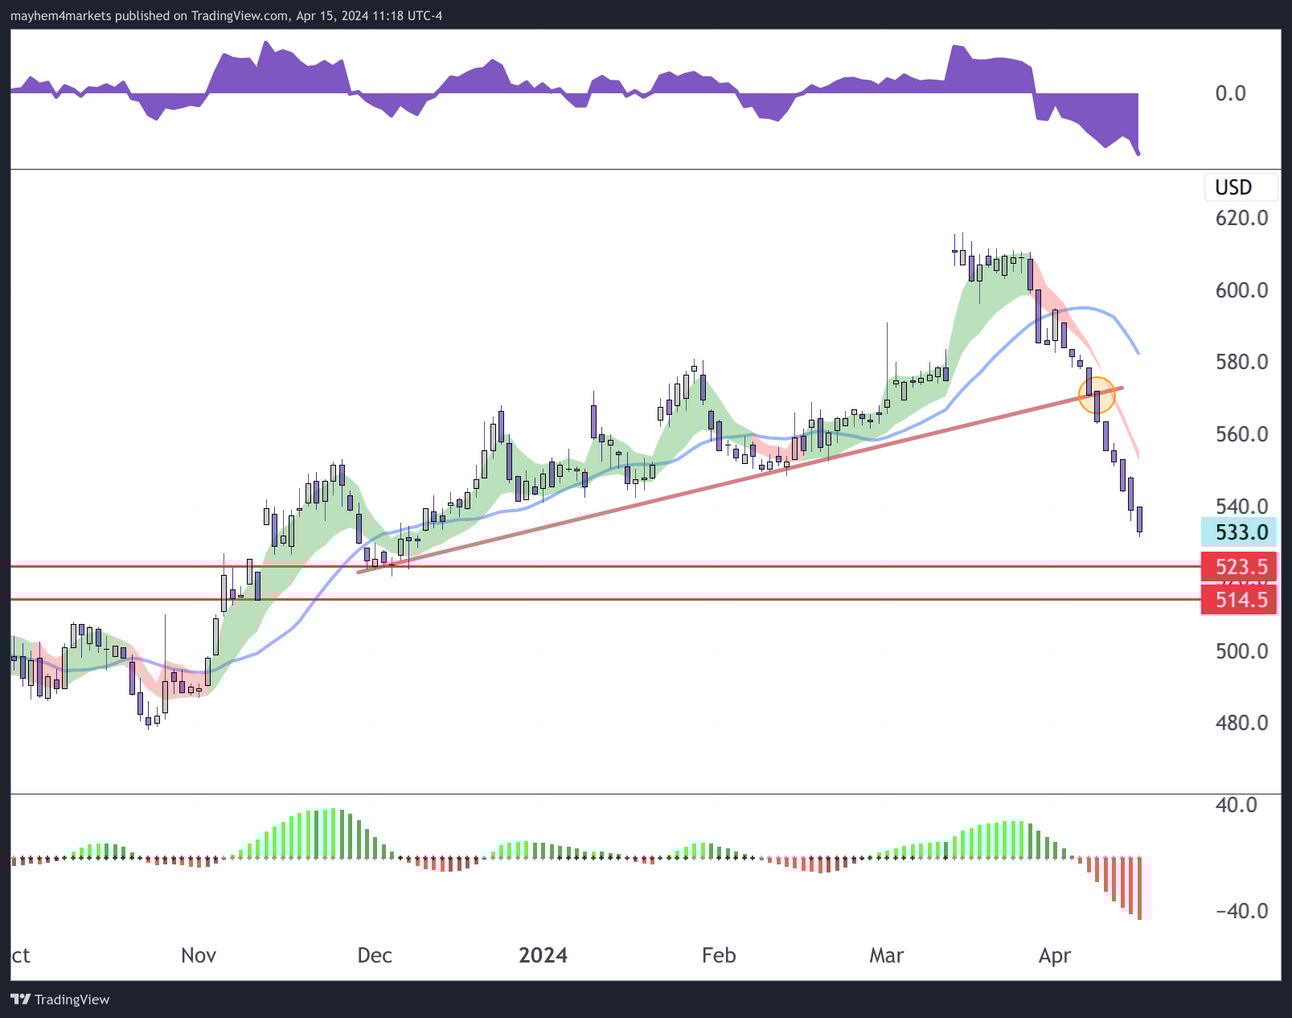
Lumber
The downside momentum in lumber has been rather aggressive. The next areas of potential support that we’re watching are $523.50 and $514.50. The commodity is under increasing pressure as we see home building slowing.
Bitcoin
The cryptocurrency fell over the weekend due to rising geopolitical tensions provoking some liquidation pressure. The uptrend is no longer intact here, and sellers enjoy a near-term technical advantage.

We also see the momentum of inflows in bitcoin dropping, which could add pressure to the cryptocurrency should there be another risk-off event.
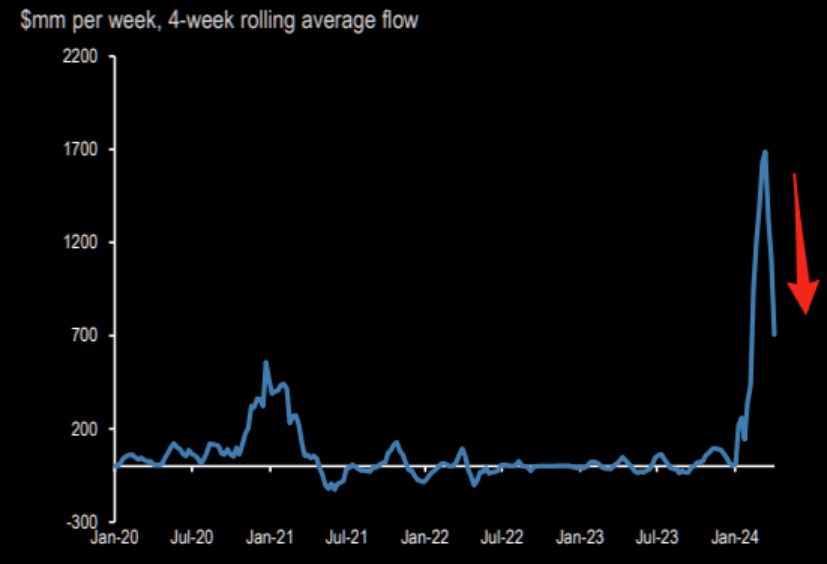
Chart: JP Morgan
Emerging Markets
We remain cautious and vigilant on equities this week, and currencies due to a stronger dollar. Geopolitical tensions may have taken a pause today but, the situation continues to remain volatile and may impact global market pricing. A stronger USD puts further pressure on EM currencies. This could mean we see inflation pick up even further because of currency weakness, in addition to rising commodity prices, and shortages from weather conditions.

India
While momentum is still bullish, we’re seeing some slowdown. India starts their 6-week election process to elect 543 members on 19 April (Friday) and will end on 01 June. Stocks may experience volatility during this period.
Philippines
The Philippines is signaling negative momentum. Equities have taken a turn lower and we continue to see pressure.
South Korea
The Kospi was under pressure all day today and we’re likely to see this momentum continue. We don’t have any major economic events to reverse this.
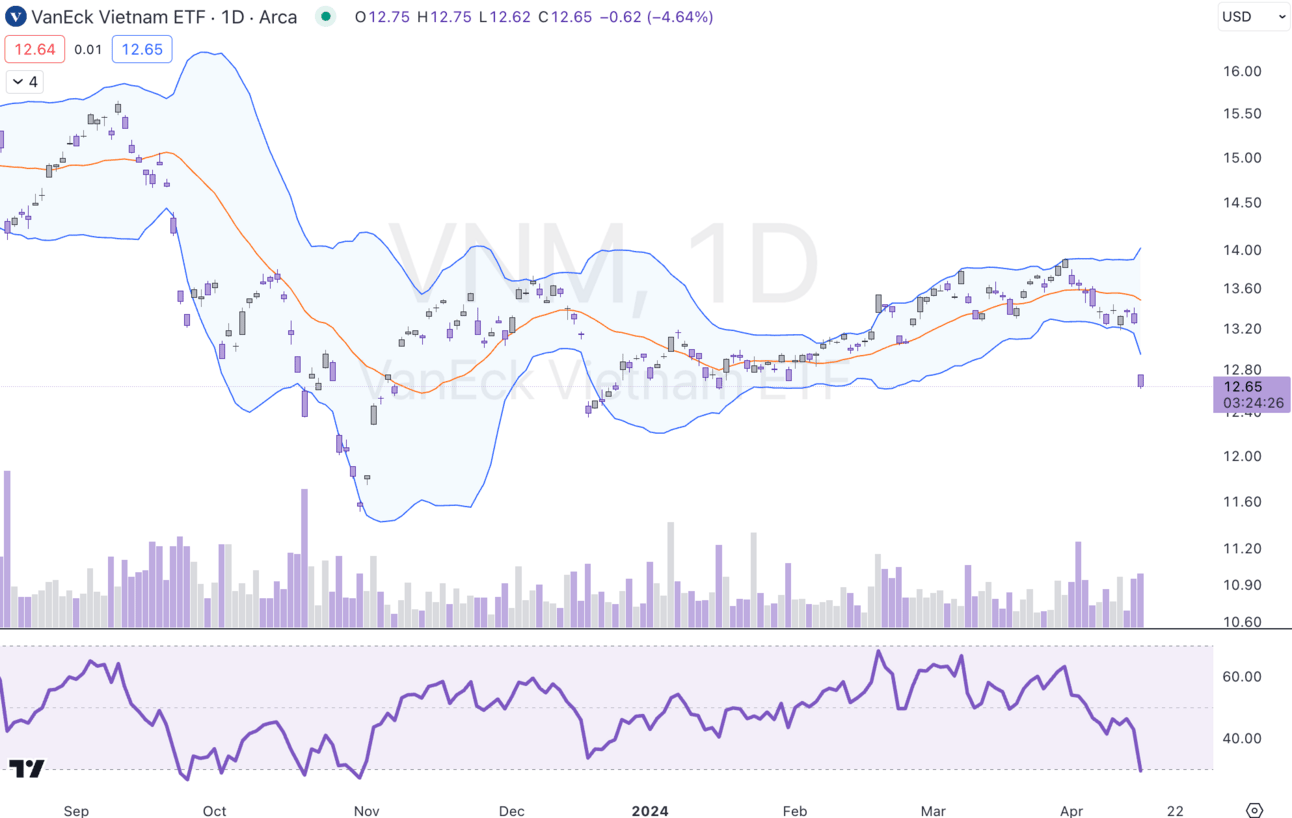
Vietnam
The market has been volatile in Vietnam, in the short term. Equities have fallen off a cliff and are signaling extreme negative momentum for now.
Brazil
Brazil continues to show negative momentum despite elevated commodity prices (which is good for the major equities) and lower inflation data coming in last week.
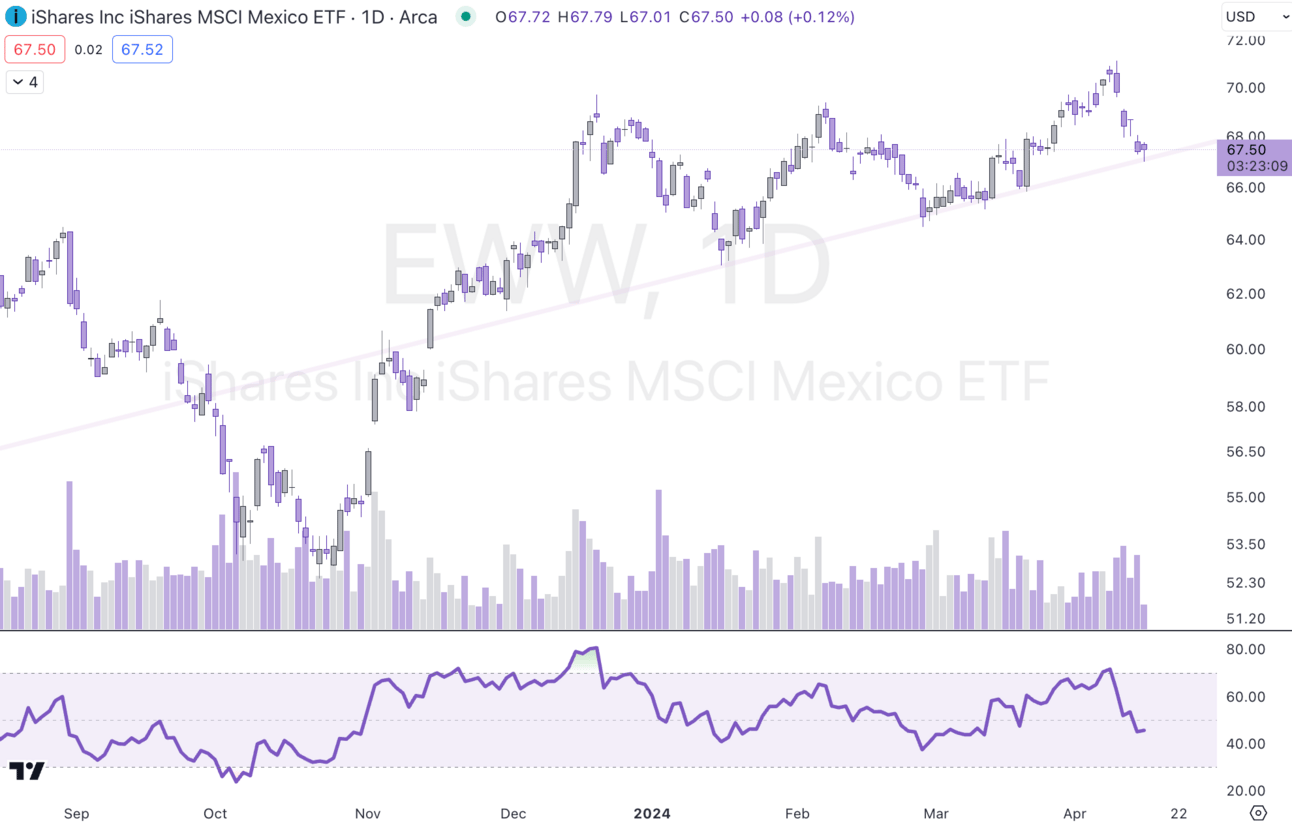
Mexico
Mexico released inflation data last week. Headline inflation came in higher YoY compared to the previous month (4.42 vs. 4.4% Prior) but Core Inflation decelerated (4.55% vs. 4.62% prior). Industrial production also came in stronger, rising to 3.3% from 2.7% prior. Momentum in equities is slowing somewhat but the market still remains in an uptrend.
Malaysia
Momentum has reversed to neutral.
South Africa
Momentum has reversed to neutral.
Saudi Arabia
While we remain bullish on Saudi equities for the quarter, the proximity to the Middle East geopolitical tensions is causing some pressure on equities in the interim.
Key 🔑
When we look at momentum drivers, we qualify them on the basis of a score between -3 and +3, with 0 being neutral.
Our model takes into consideration many factors when we calculate momentum on a weekly basis, and the way we built this system is to help update our audience on week-over-week momentum changes.
Macro drivers (varied weightings as appropriate)
Rates
Inflation
GDP growth
LEIs
Liquidity
Gov’t intervention
Earnings
Options structure
Intermarket dynamics
Demand and Supply conditions (for Commodities)
Momentum Drivers
RSI
Volume Profile
Relevant Oscillators (NYMO, NAMO)
Ichimoku cloud
Key moving averages
Sentiment
Flows (futures, ETFs, options)
Positioning (futures, ETFs, options)
RV vs IV
Volatility skew
