
In addition to providing precious metals market analyses and other economic reports, I also like to include tutorials that teach helpful tips and tricks to help subscribers become more competent and confident investors and traders, as well as to understand my analyses better.
In today’s tutorial, I am going to teach you how to use trading volume to confirm breakouts or not confirm them, which is a powerful but simple technique that greatly increases the probability of getting on board winning trades rather than ones that fizzle out quickly and trap you in a bad trade. I will show many examples of this in a wide variety of different assets and then show you what it is telling about gold and silver right now.
Trading volume is one of the most basic indicators, if it can even be called an indicator, yet it is poorly understood and often underutilized, which is a shame. Many traders and investors fixate on asset prices, chart patterns, and price-based indicators, but few pay much attention to volume. With this lesson, I hope to encourage you to focus more on volume and to better understand what you are seeing when you analyze it.
Unlike many exotic or complex indicators, virtually all charting platforms allow you to add trading volume to your charts. This includes free services like StockCharts.com and Finviz.com, as well as premium platforms like TradingView, which is what I use for the charts you see in this newsletter.
As shown in the example using gold futures below, volume is plotted beneath the asset’s price chart as a histogram and, depending on the type of asset, displays the number of shares (for stocks) or contracts (for futures) traded during a specific time period, whether that is 1 minute, 1 hour, 1 day, 1 week, 1 month, and so on.
If the asset is up during a given time period, the volume bar is colored green, and the general assumption is that most of the volume represents buying. Conversely, if the asset is down during that time period, the volume bar is colored red, and the assumption is that most of the volume represents selling.
Volume is useful for confirming important moves because it lets you know if big institutions (the “smart money”) are behind it and getting in on the action. If you are interested in going long (i.e., buying), you want to see heavy volume during a bullish breakout and subsequent rally to confirm that there is real fuel behind it.
On the other hand, if there is a breakout or rally but volume is weak, that means there is little conviction behind it and that it is mostly retail traders (the “dumb money”) driving it and that institutions are not on board, likely because they know something, or even worse, because they are trying to engineer a false move to generate liquidity from retail traders so that they can bet in the opposite manner.
Now, that does not mean an asset can never rally successfully without heavy volume or that every breakout on heavy volume will succeed and lead to further gains. As with everything in the markets and in trading, it is about putting probability in your favor.
Breakouts on strong volume have a much higher probability of succeeding than breakouts on weak volume, and I will demonstrate that today with numerous examples from a wide variety of assets and markets. This is a universal principle that works for virtually every type of asset, including precious metals, commodities, stocks, ETFs, financial futures, currencies, cryptos, and bonds.
One point I want to make about volume in precious metals is that COMEX futures are the best place to monitor volume because that is where most price discovery occurs. The spot market, on the other hand, does not report volume, although charting services often show tick volume, which is a proxy for actual trading volume based on price changes (ticks) within a specific time period. It is often a decent approximation, but COMEX futures volume is much more accurate for analysis purposes like what we are doing today.
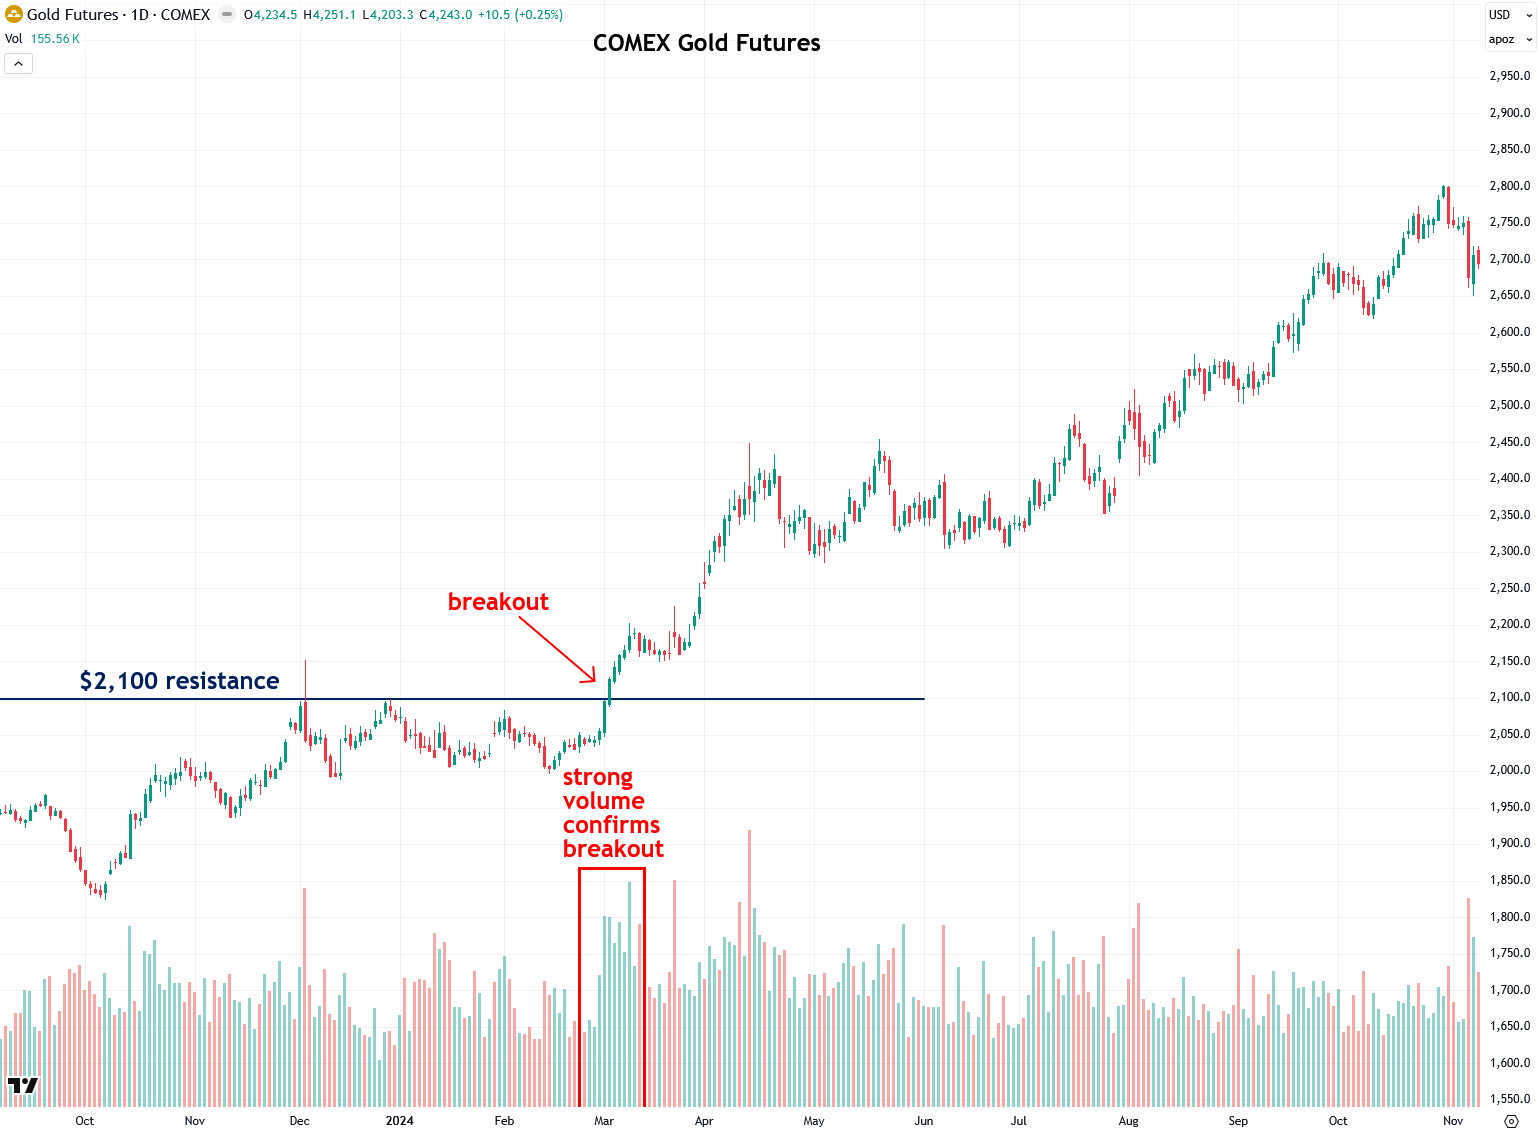
So let’s look at some examples of successful breakouts and how trading volume was used to confirm them, starting with COMEX gold futures in March 2024, which is the breakout that led to the powerful bull market gold is in now.
From 2020 until March 2024, gold had been capped under its $2,000 to $2,100 resistance zone, and many attempts to break above it failed. But it finally happened on March 1st, 2024, and I suspected it was about to happen and posted about it on Twitter/X just hours before it began.
COMEX gold surged above $2,100 and volume surged in confirmation, and not just for one day but for many days, which is even more ideal and meaningful than a single-day volume spike. That surge in volume meant that the smart money or institutions were jumping on board the rally, which greatly increased the probability of it working out, as it ultimately did.
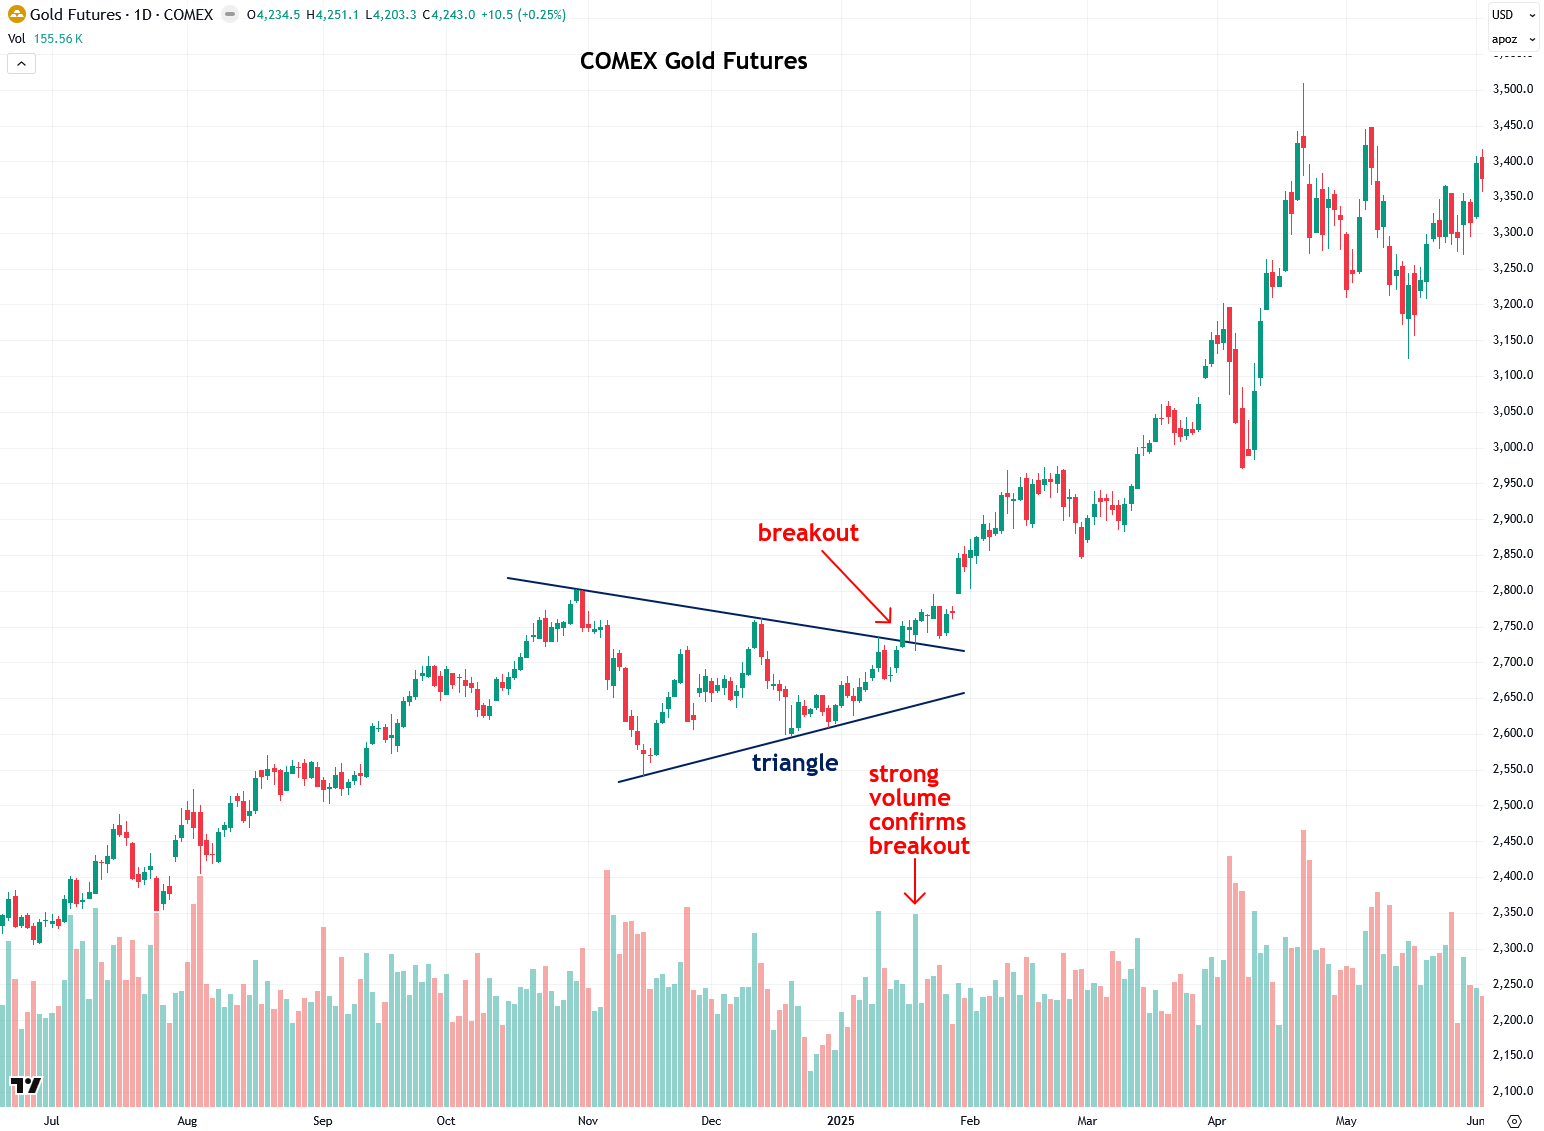
Another beautiful example in gold came later in 2024, when a breakout from a triangle pattern that I wrote about led to a strong surge from $2,750 to $3,500 over the following few months. Notice how volume surged on the day of the breakout, confirming it.
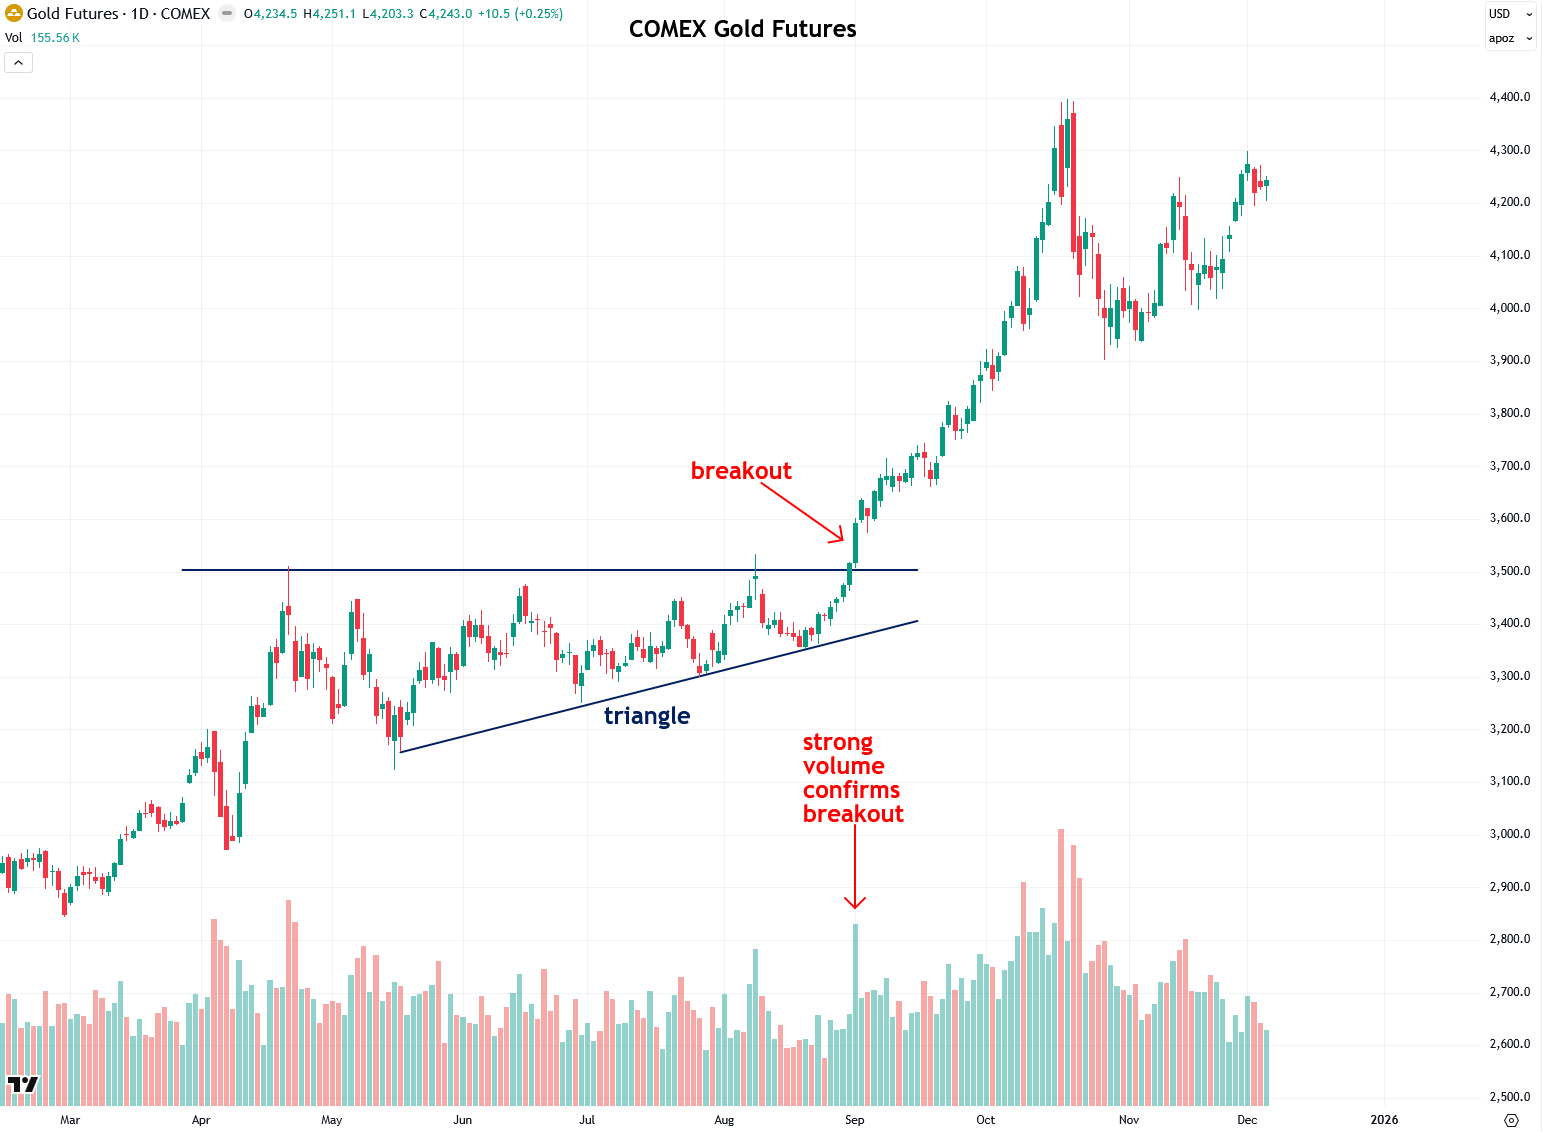
As if those two other textbook breakouts were not enough, it occurred yet again when gold broke out in September 2025 from the summer triangle pattern I had spotted, and volume spiked strongly, giving the go-ahead signal.
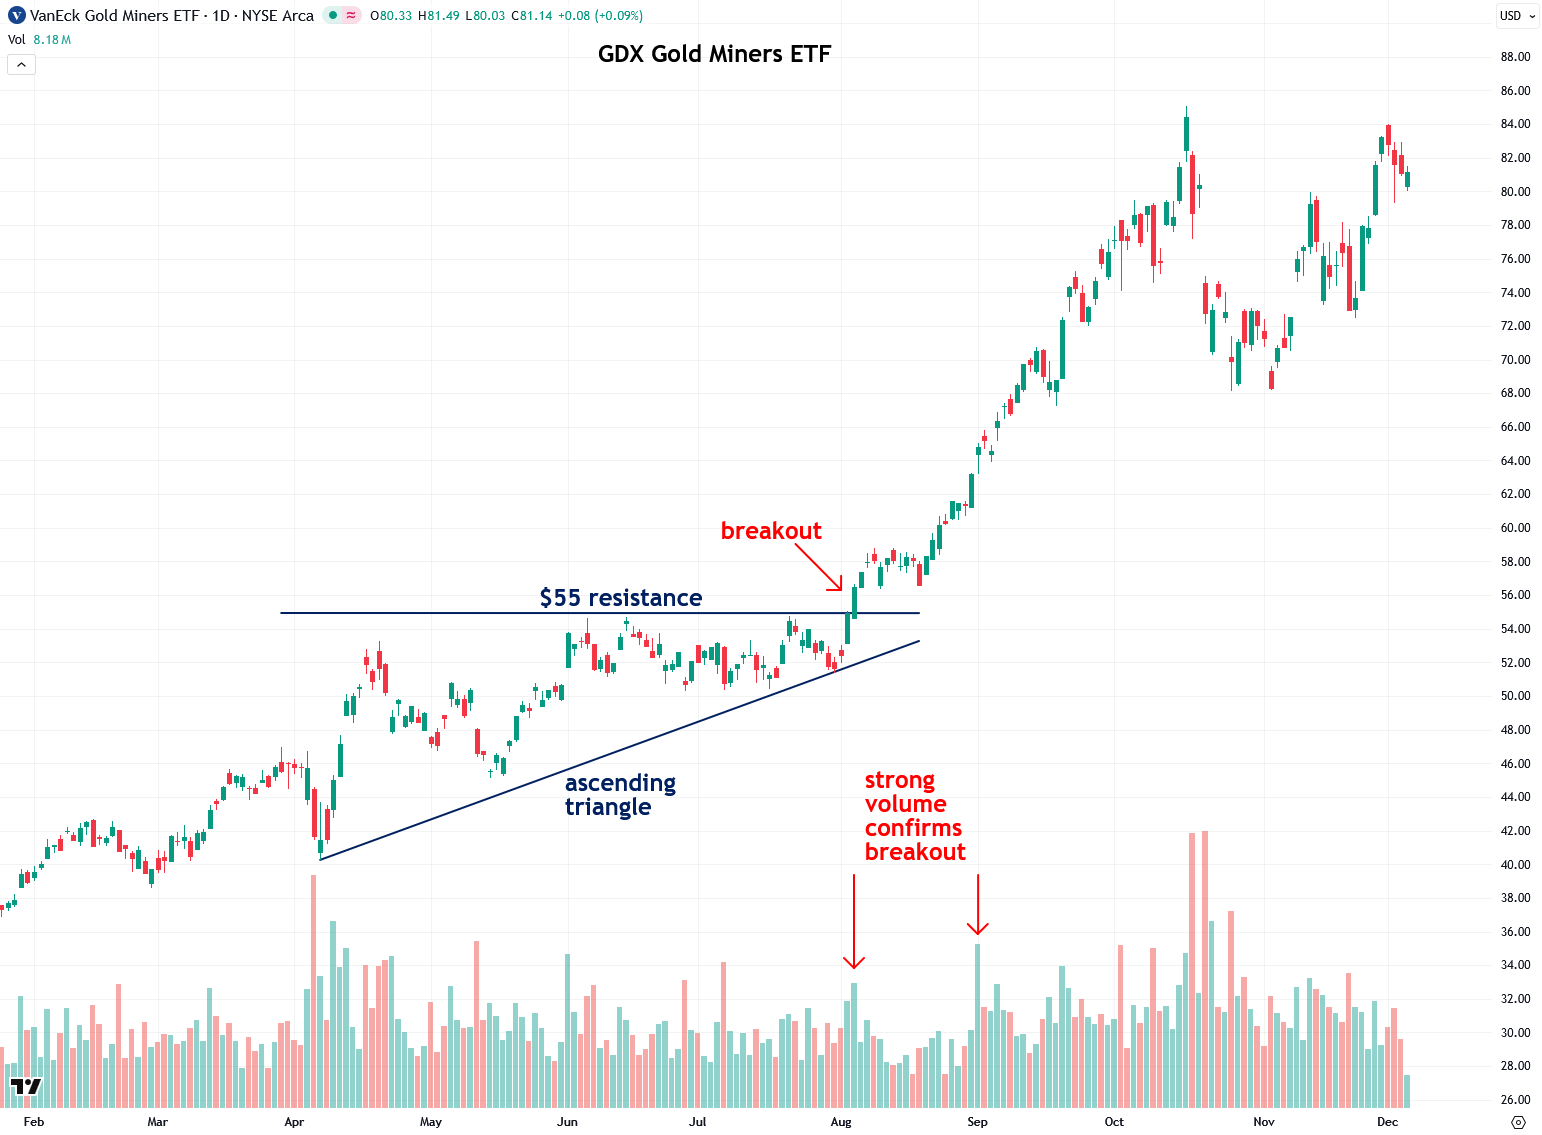
Next, let’s look at the popular VanEck Gold Miners ETF (GDX), which formed an ascending triangle in spring 2025 and broke out above its $55 resistance in early August with strong volume, resulting in a quick surge to $82 over the next couple of months.
Also note that there was a subsequent volume spike after the initial breakout, and that is common during strong rallies. The more of these spikes that appear, the better, as they continue to provide bullish confirmation as institutions pile in.
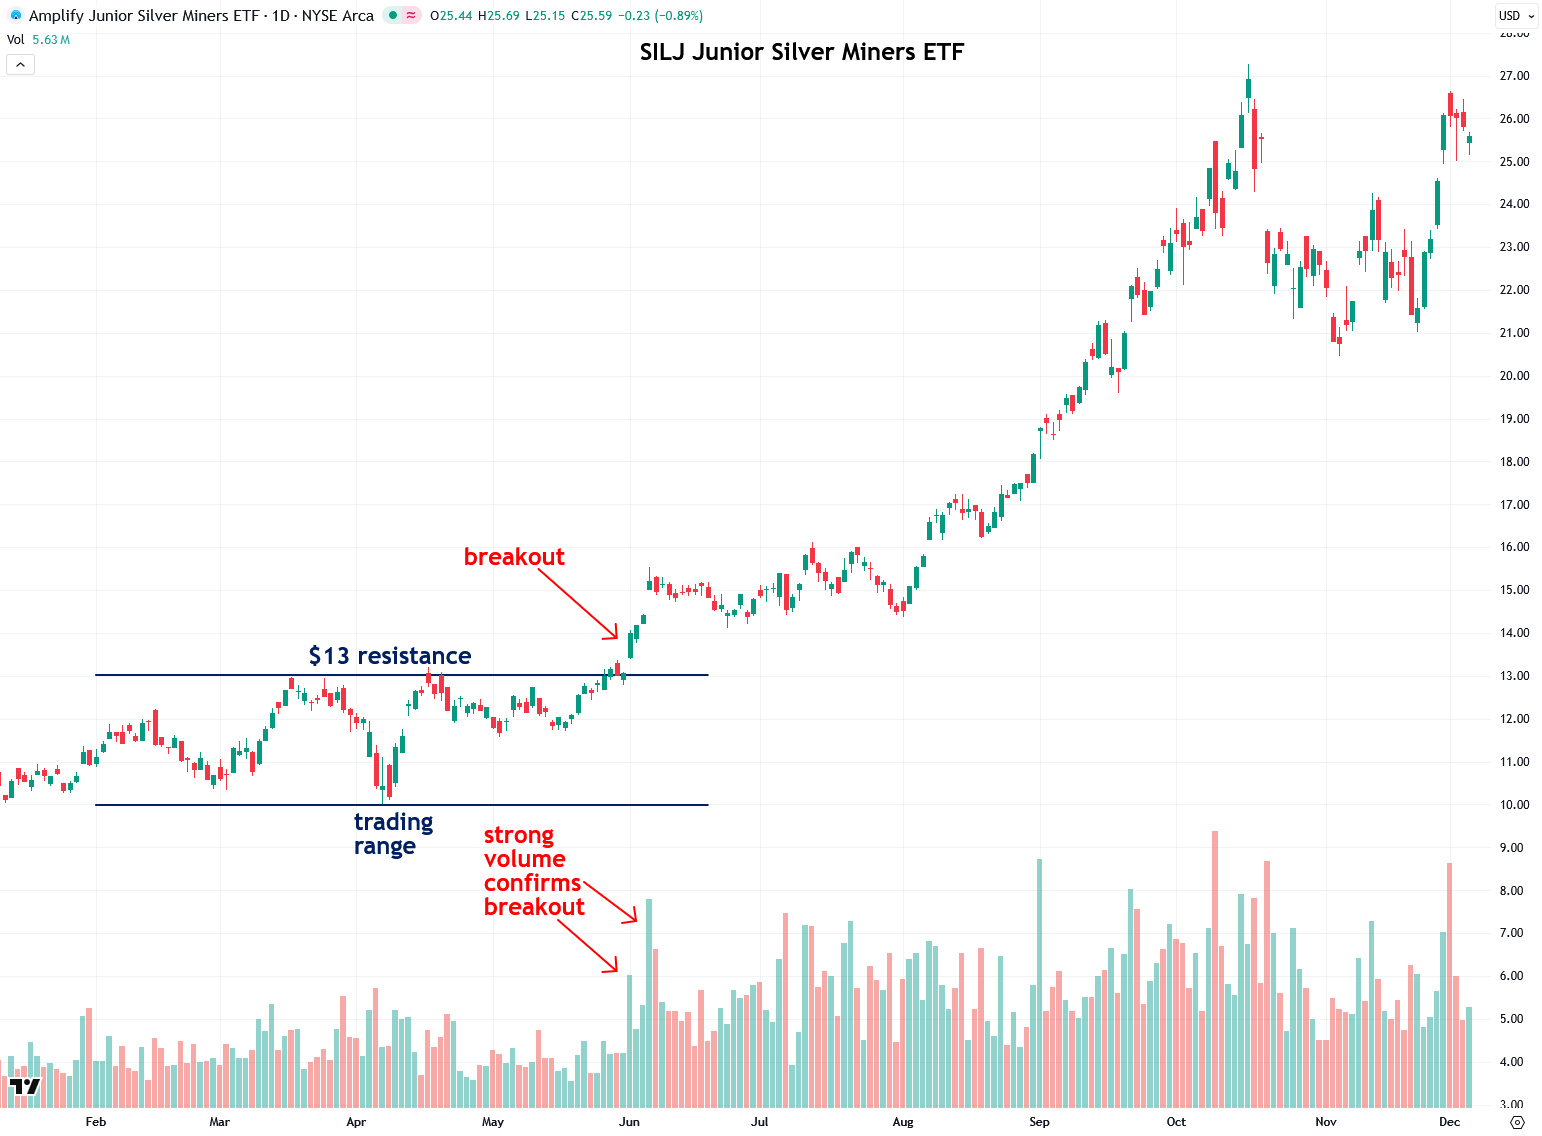
A similar breakout occurred in the Amplify Junior Silver Miners ETF (SILJ) after it had been in a trading range in the spring of 2025 and then broke out above the $13 resistance, accompanied by multiple days of strong volume. That breakout ultimately led to a doubling in price in just four and a half months.
Next, let’s look at the junior silver miner Apollo Silver, which I wrote a bullish report on in late June of this year. It had formed a triangle pattern from June to August, and then it broke out on strong volume and subsequently more than doubled in just a matter of months, and it is still going strong.
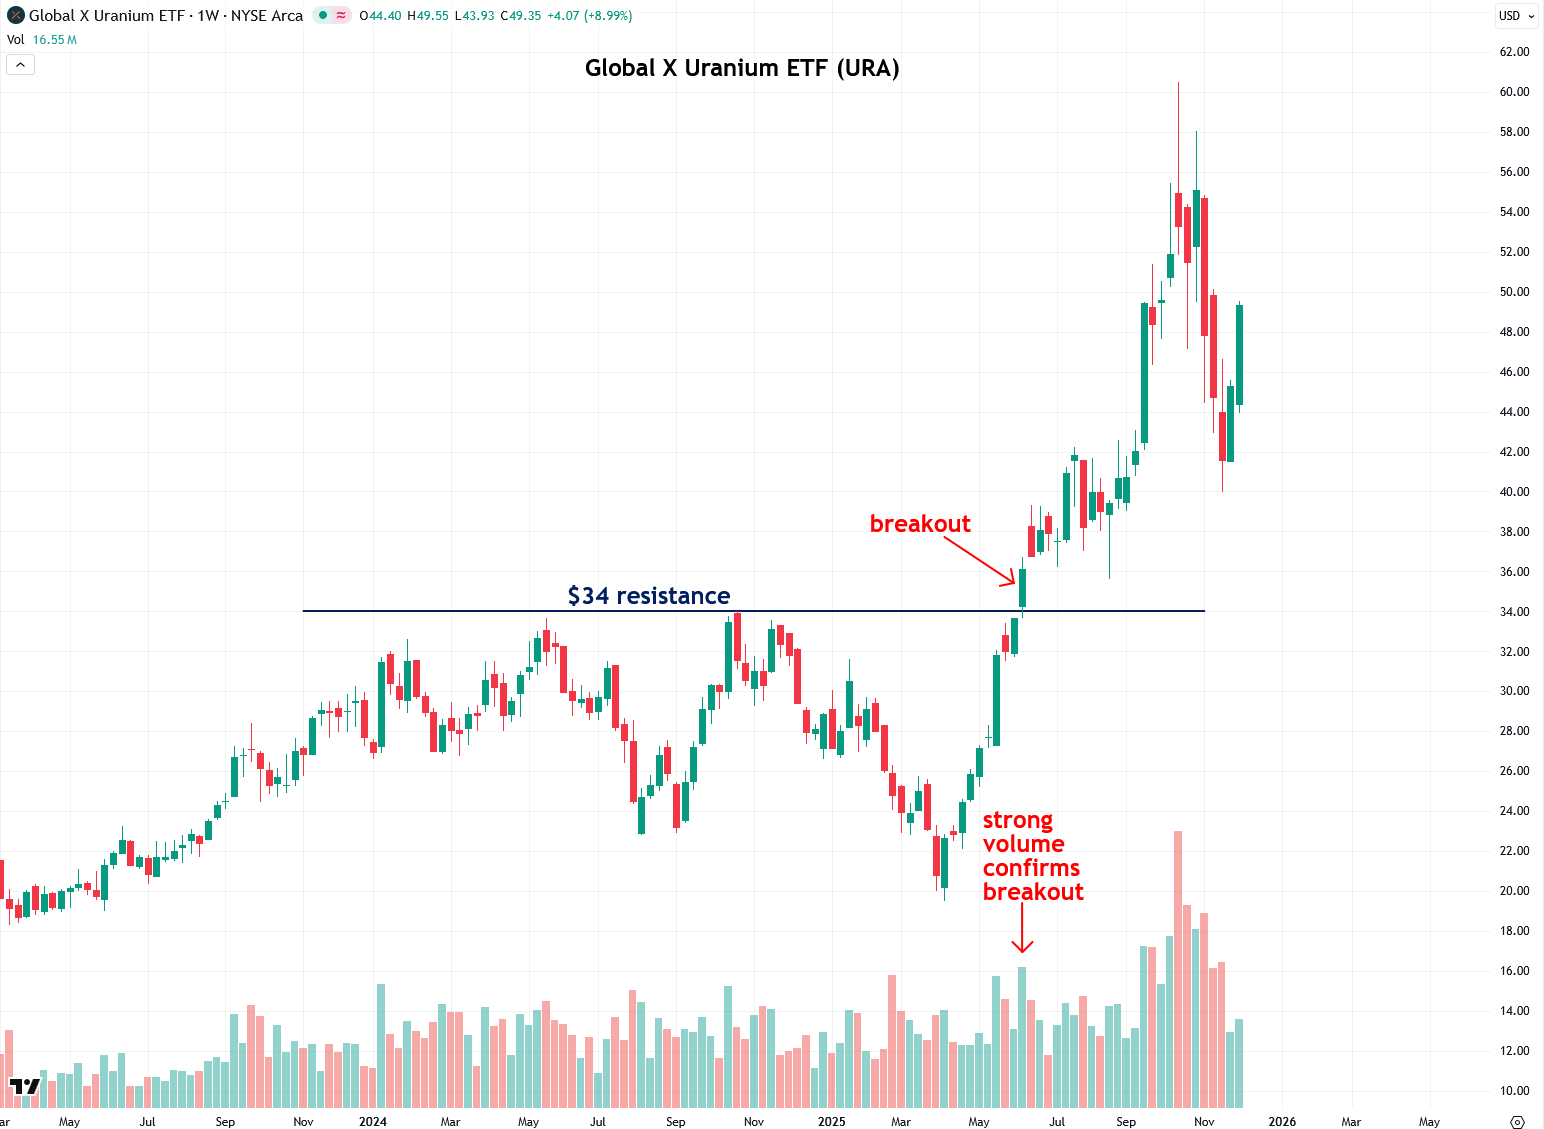
So let’s now look at some examples of successful high-volume breakouts outside the precious metals arena, starting with the Global X Uranium ETF (URA).
Note that I am using a weekly chart in this example, which I sometimes prefer because it reduces day-to-day noise. I often toggle back and forth between the daily and weekly charts and monitor both the volume situation and the price action. This is a technique called multiple time frame analysis, and I am a big fan of it and plan to write a tutorial about it soon.
For much of 2024 and early 2025, there was a clear resistance level at $34, but URA finally broke above it in May 2025 on strong volume and subsequently rallied to $60 in the following months.
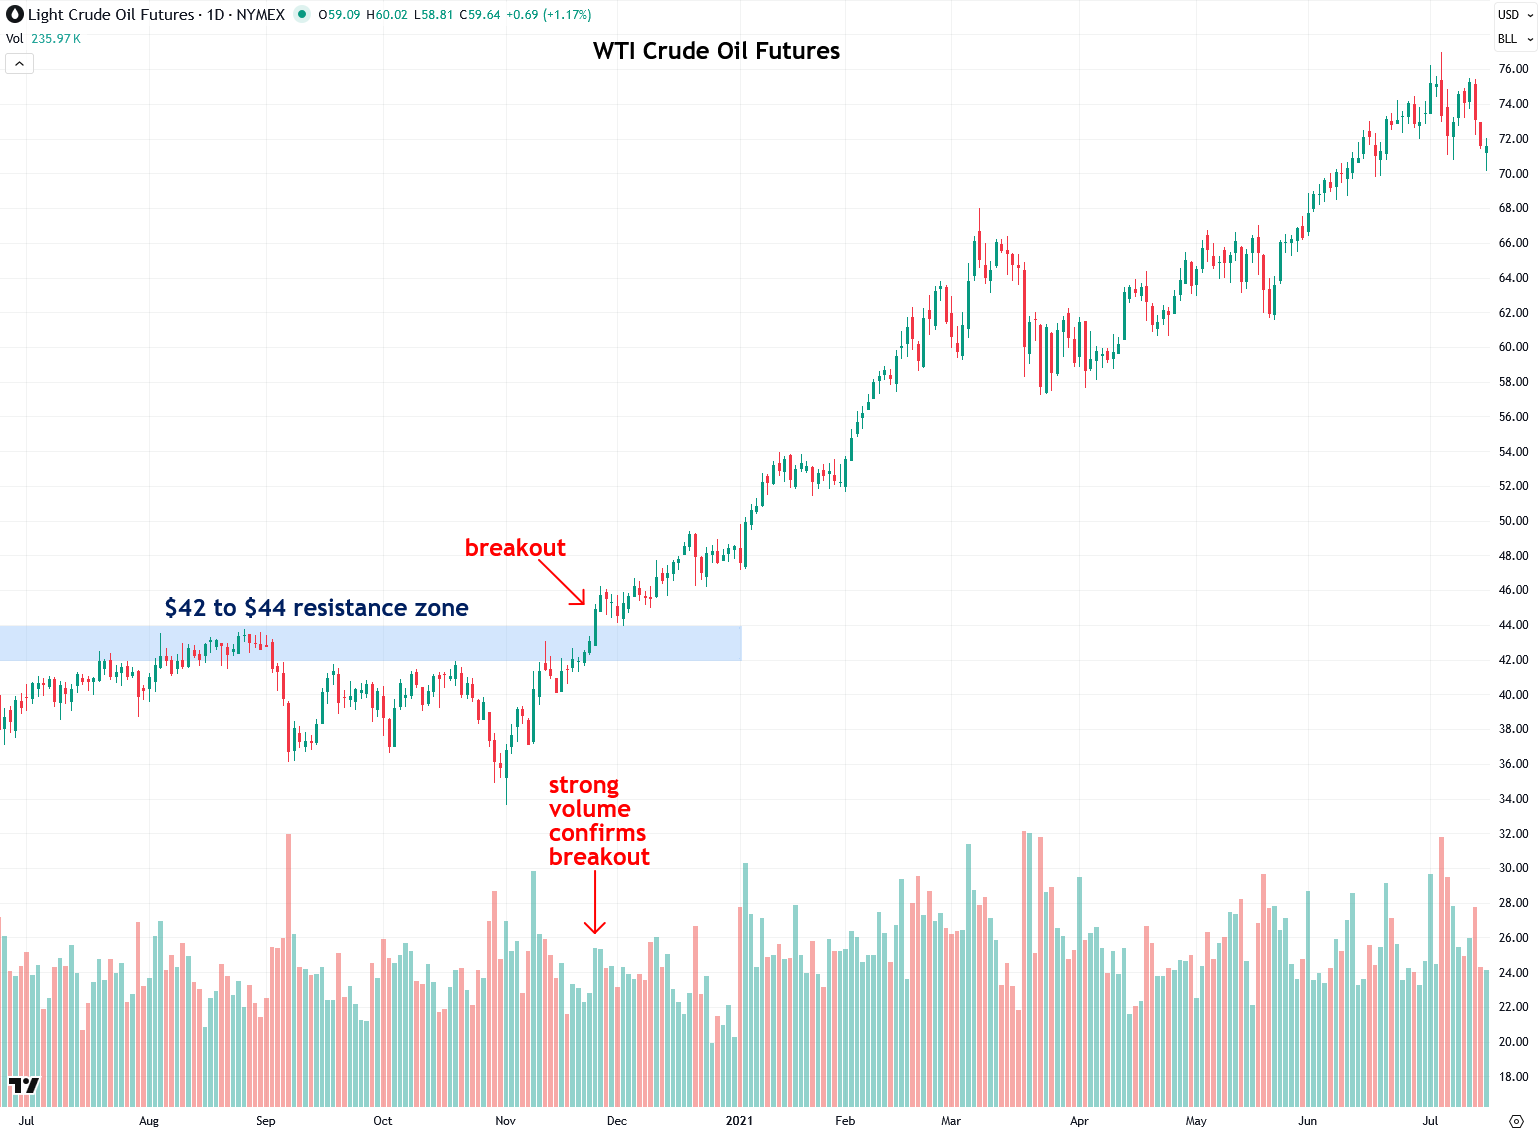
Next, let’s look at an exciting example in crude oil futures from 2020, which had been capped under the $42 to $44 resistance zone until the high-volume breakout in November kicked off a rally that carried prices as high as $130 by March 2022.
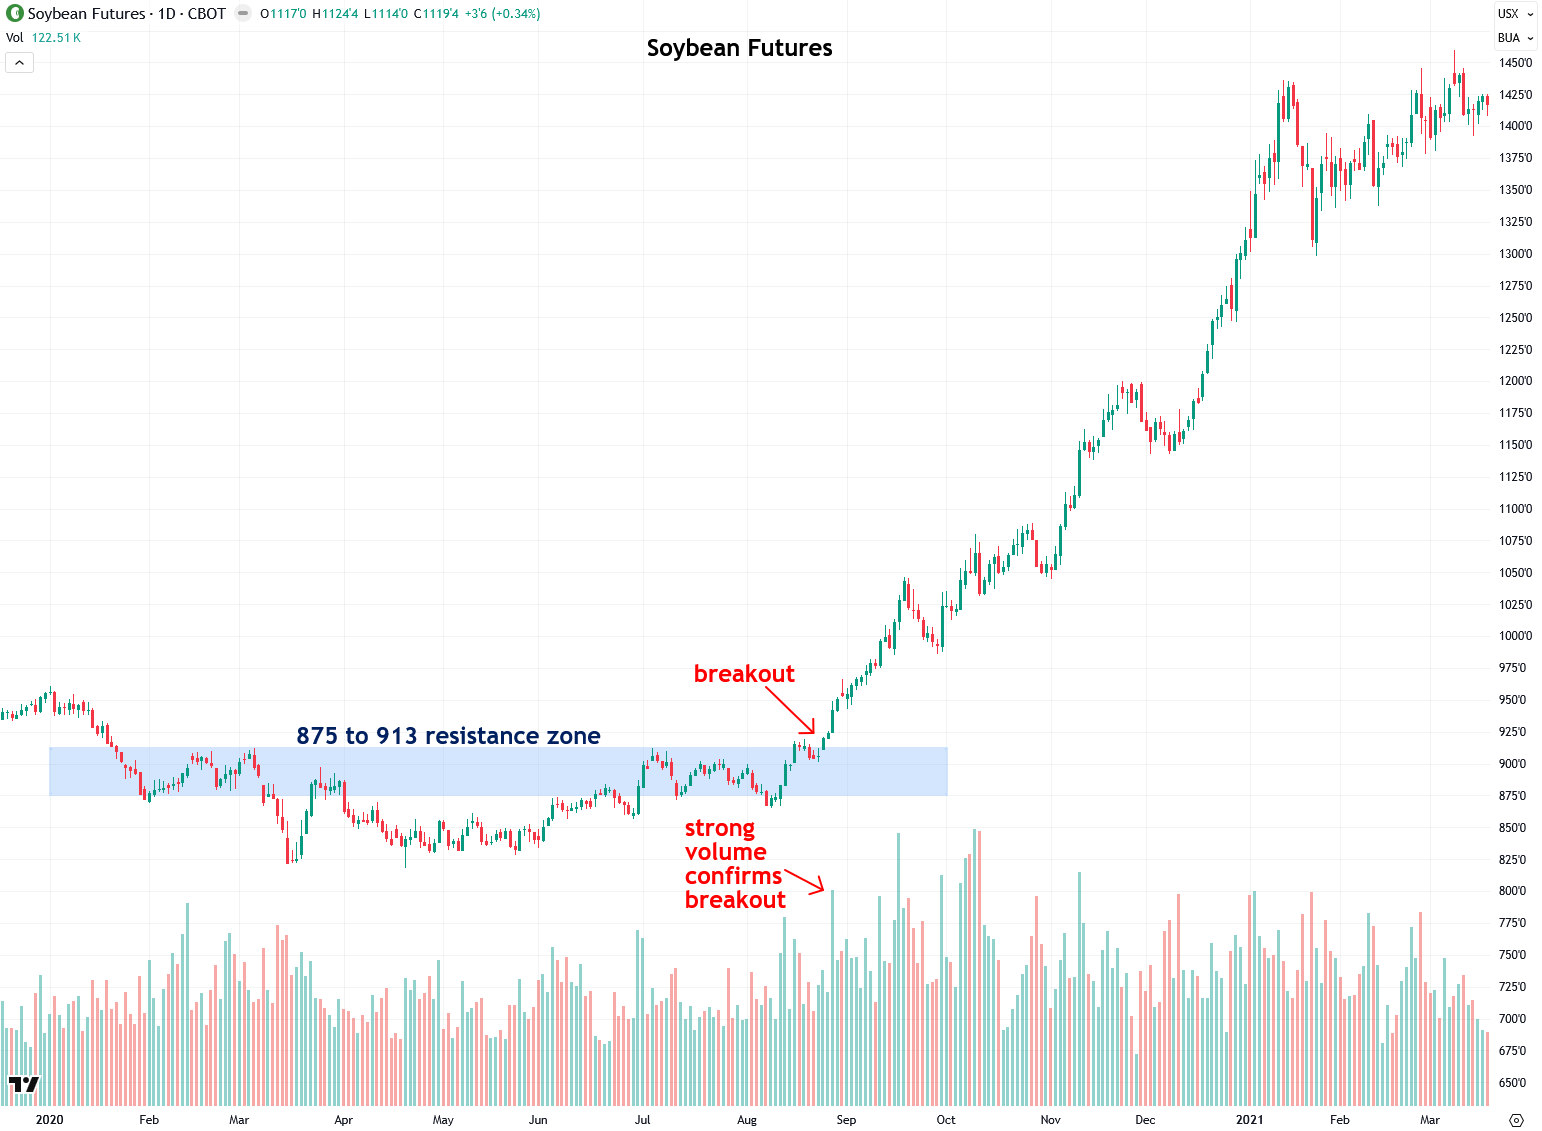
Also in 2020, soybeans had struggled under the 875 to 913 resistance zone until their high-volume breakout in August, which led to a rally that reached as high as 1784 by June 2022.
It’s also worth noting that there were subsequent volume spikes well after the initial breakout, and those provided further bullish confirmation, which is ideally what you want to see.
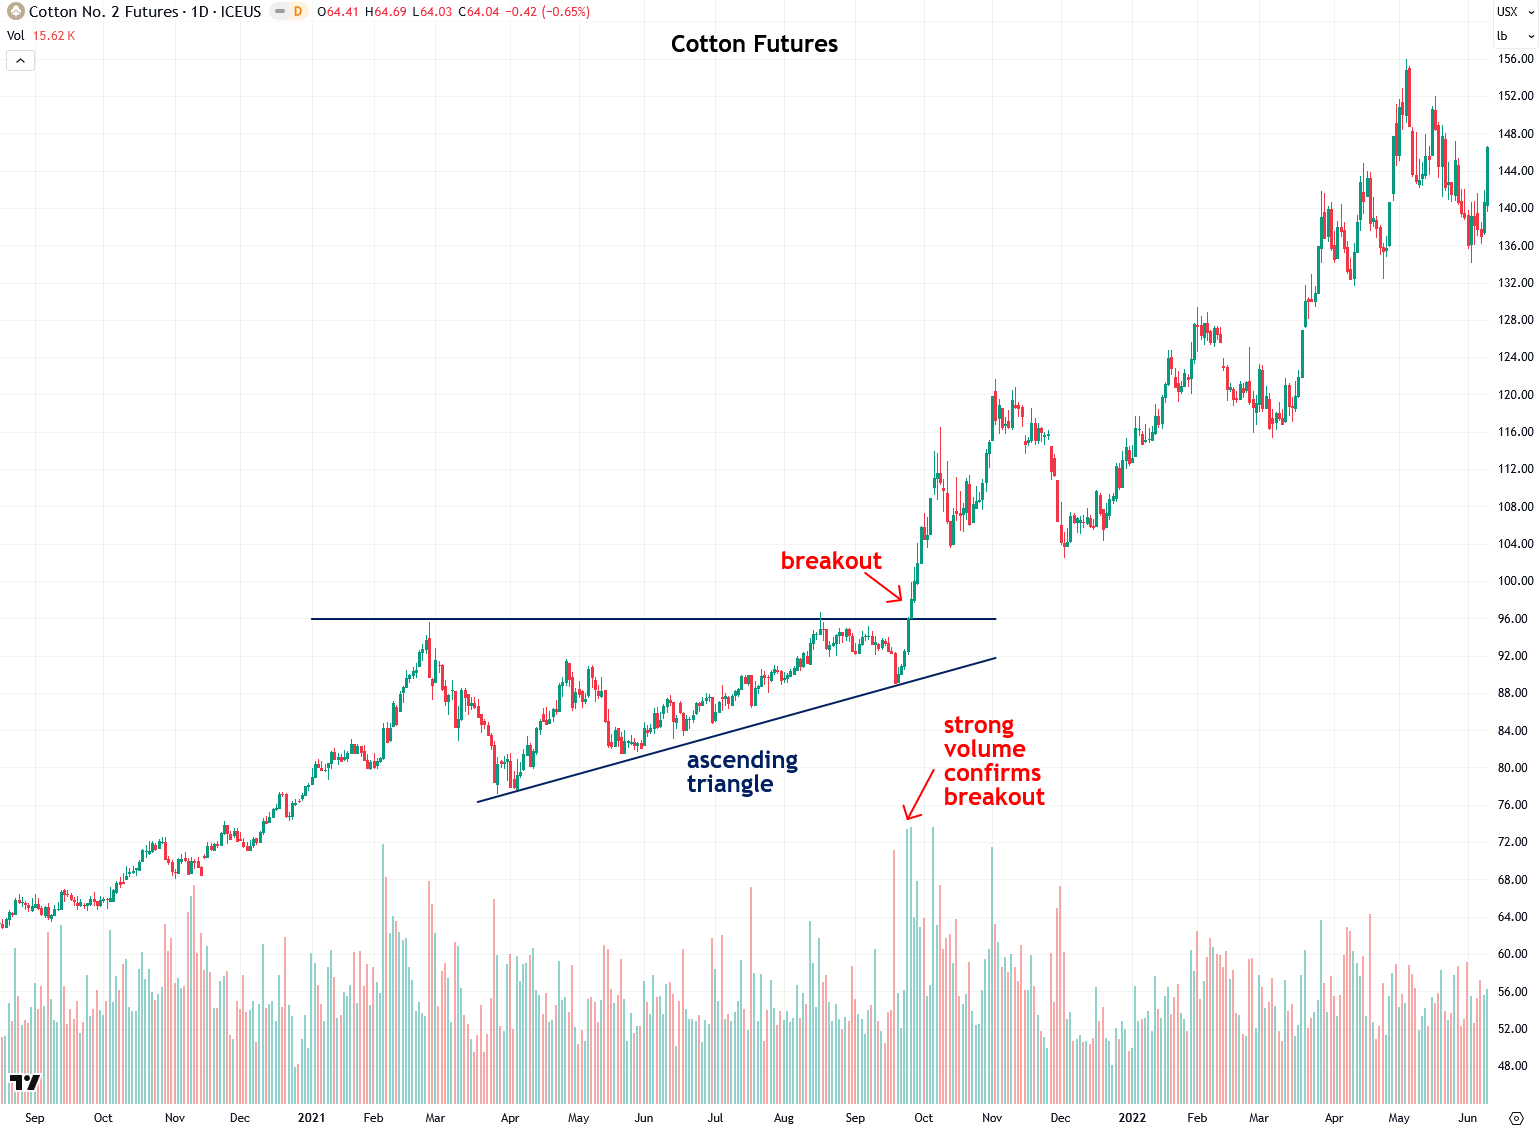
For much of 2021, an ascending triangle had formed in cotton with a resistance level of $96, and it finally broke out in September of that year with multiple days of strong volume for added confirmation. That breakout led to a surge as high as 156 by May 2022.
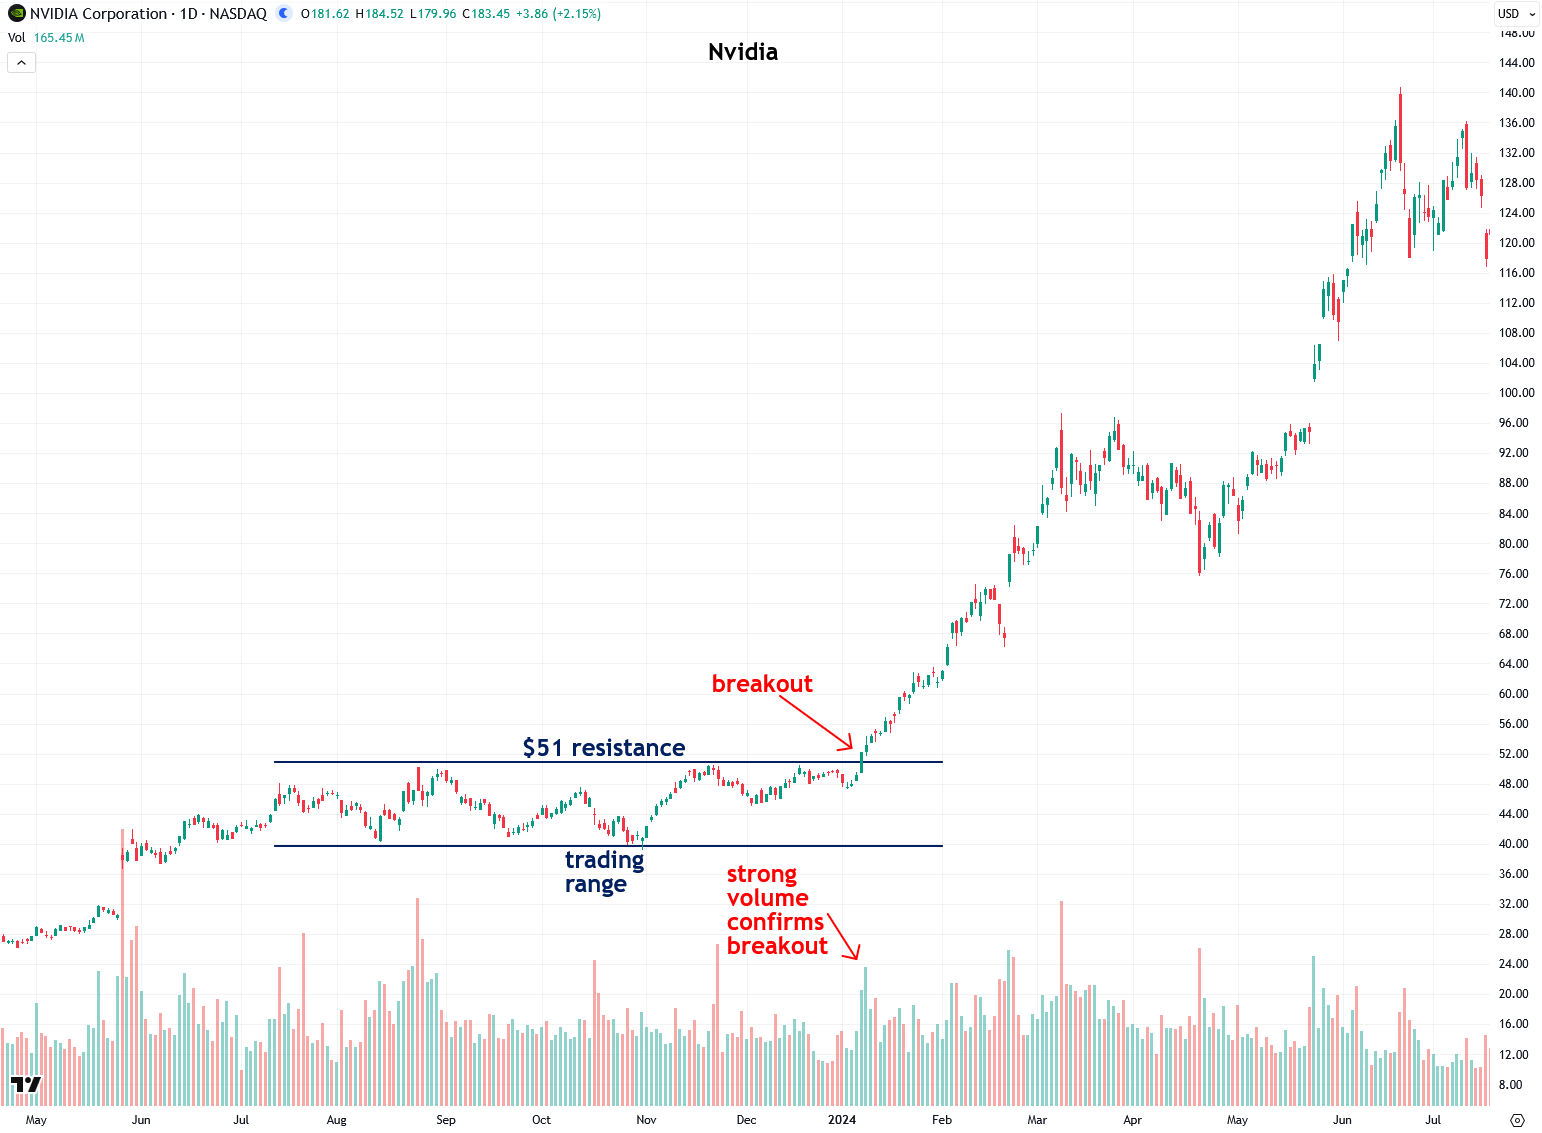
Next, let’s move on to some stocks, starting with the current market darling Nvidia. Its blistering rally began with a trading range in late 2023, and once it broke out above the $51 resistance on heavy volume, it was off to the races. It soared as high as $140 by May 2024 for a nearly threefold gain.
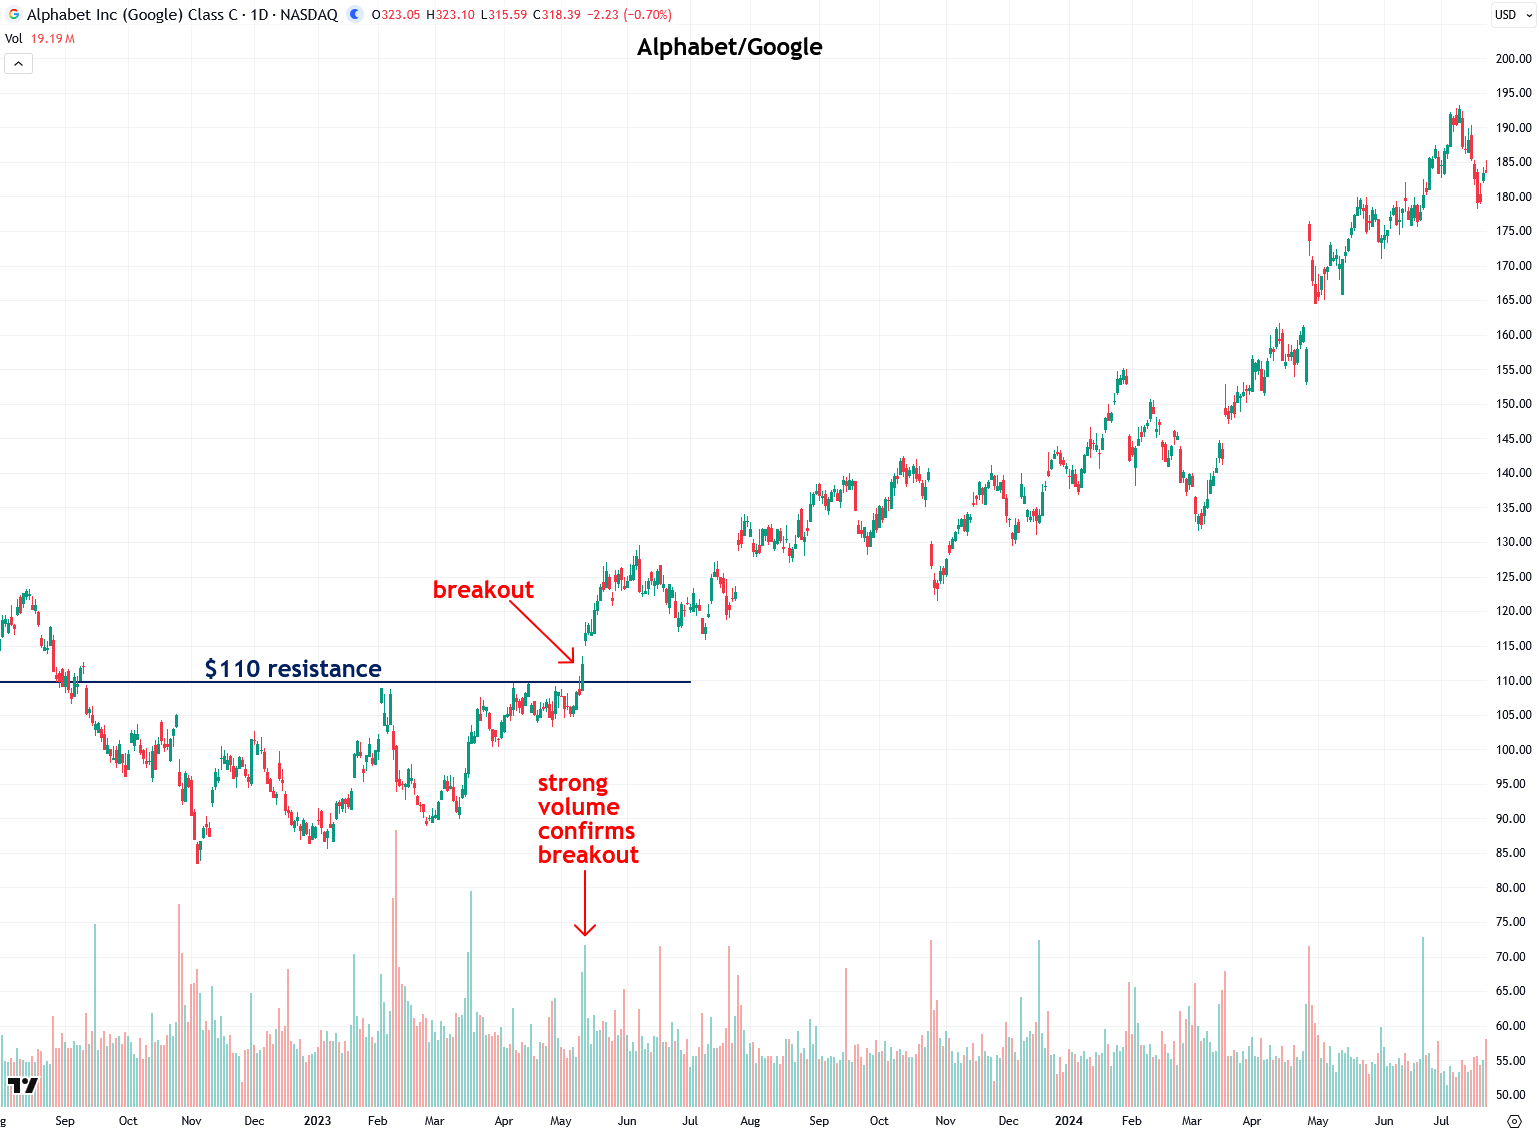
Another tech darling, Alphabet/Google, also launched into a powerful rally that is still going after a high-volume breakout above the $110 resistance in May 2023, and it surged as high as $329 recently.
It is incredible how this simple technique can spot big bull markets ahead of time without even looking at financial statements, balance sheets, news, or analysts’ expectations, and that is because all of that information and much more is already incorporated into the price and trading volume. This is one of the core tenets of technical analysis and why I am such a big believer in it.
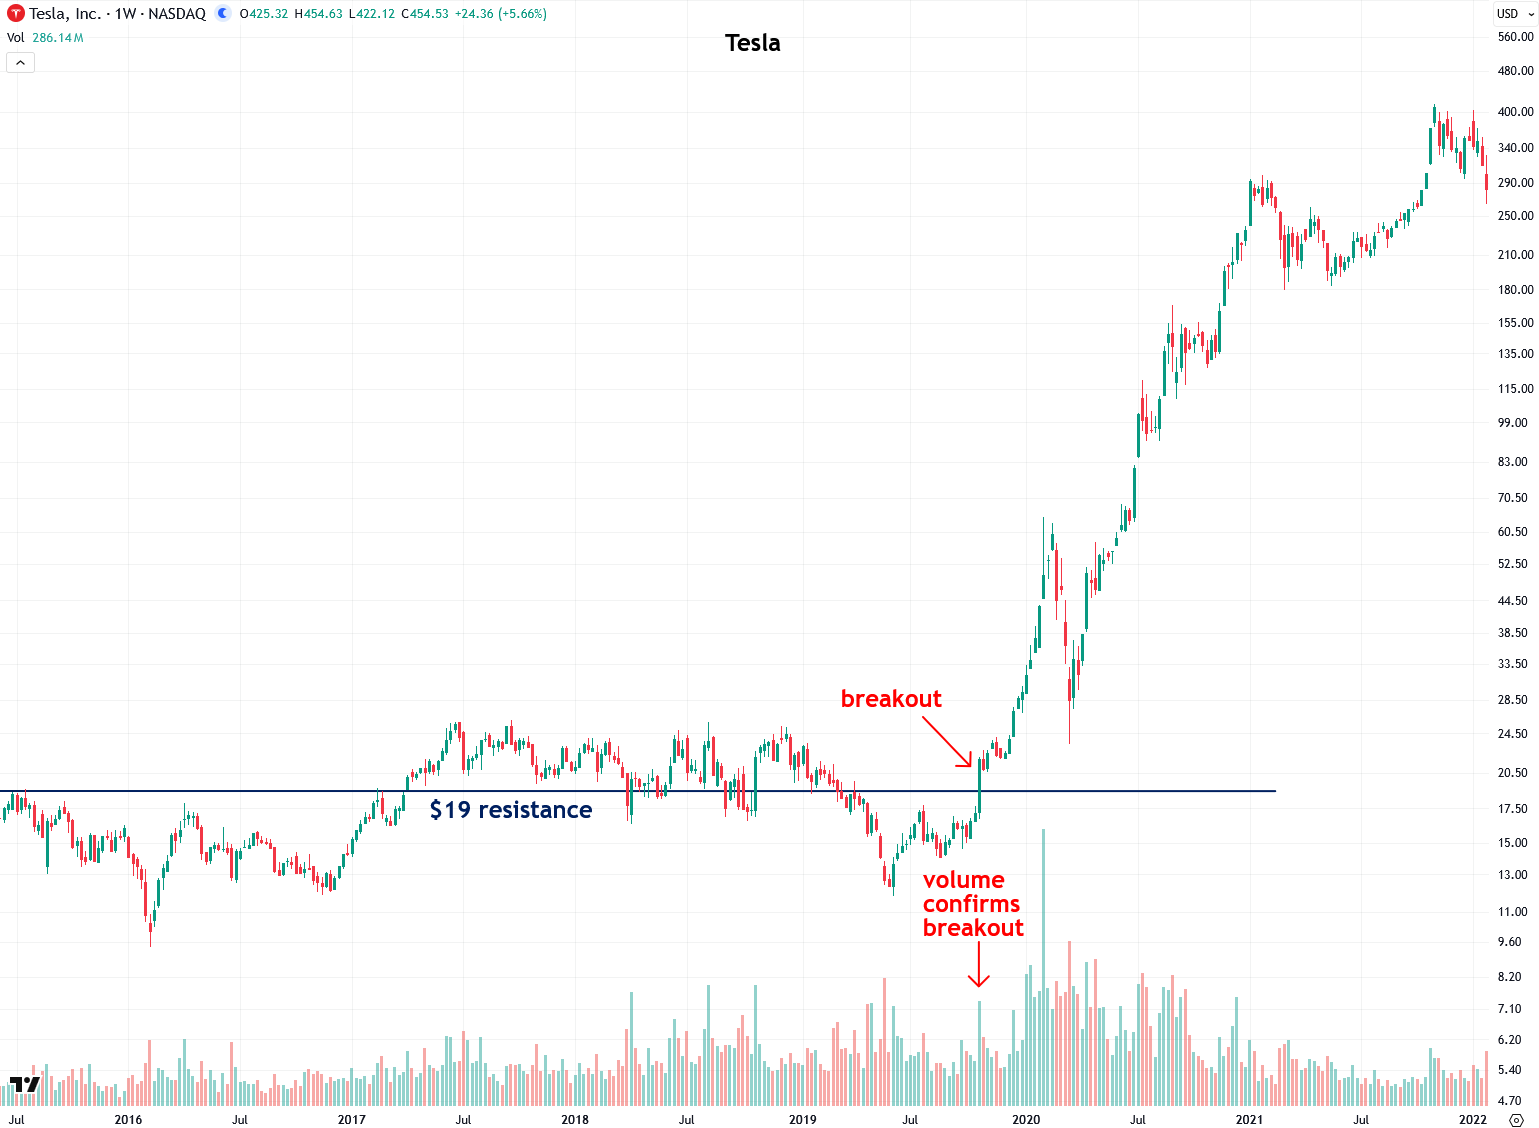
Next, let’s look at one of history’s most stellar stock performances, Tesla, using its weekly chart. From 2016 to 2019, it had been trading above and below the key $19 level, but when it finally surged above $19 on heavy volume in October 2019, that move kicked off its surge to $415 by November 2021 for an incredible gain of roughly 2,000%.
For another epic historic performance, let’s take a look at the weekly chart of Bitcoin in 2020. As I wrote in my online Forbes column at the time, a huge triangle was forming and I believed it would result in a powerful rally once it broke out, and it sure did.
When Bitcoin broke out in July 2020 on heavy volume, it surged roughly sixfold from $10,000 to just above $60,000 in a matter of months!
I was able to spot that historic bull market ahead of time without any knowledge of computer science, blockchain, cryptography, Tether, tokens, Satoshis, or any other crypto gobbledygook, relying only on plain market sense from watching price and volume. The same approach works just as well in non-technological assets such as gold, silver, cotton, soybeans, and crude oil.
Bitcoin also staged another important breakout a year ago, emerging from a channel pattern on strong volume, which I identified as it was happening. It promptly surged from $65,000 to $108,000 in roughly two months.
Take note of how volume increased, as expected, at the initial breakout, but significantly more volume came in as the move progressed. This can happen when a breakout starts off gradually, then gains momentum as additional buying interest pushes the asset higher.
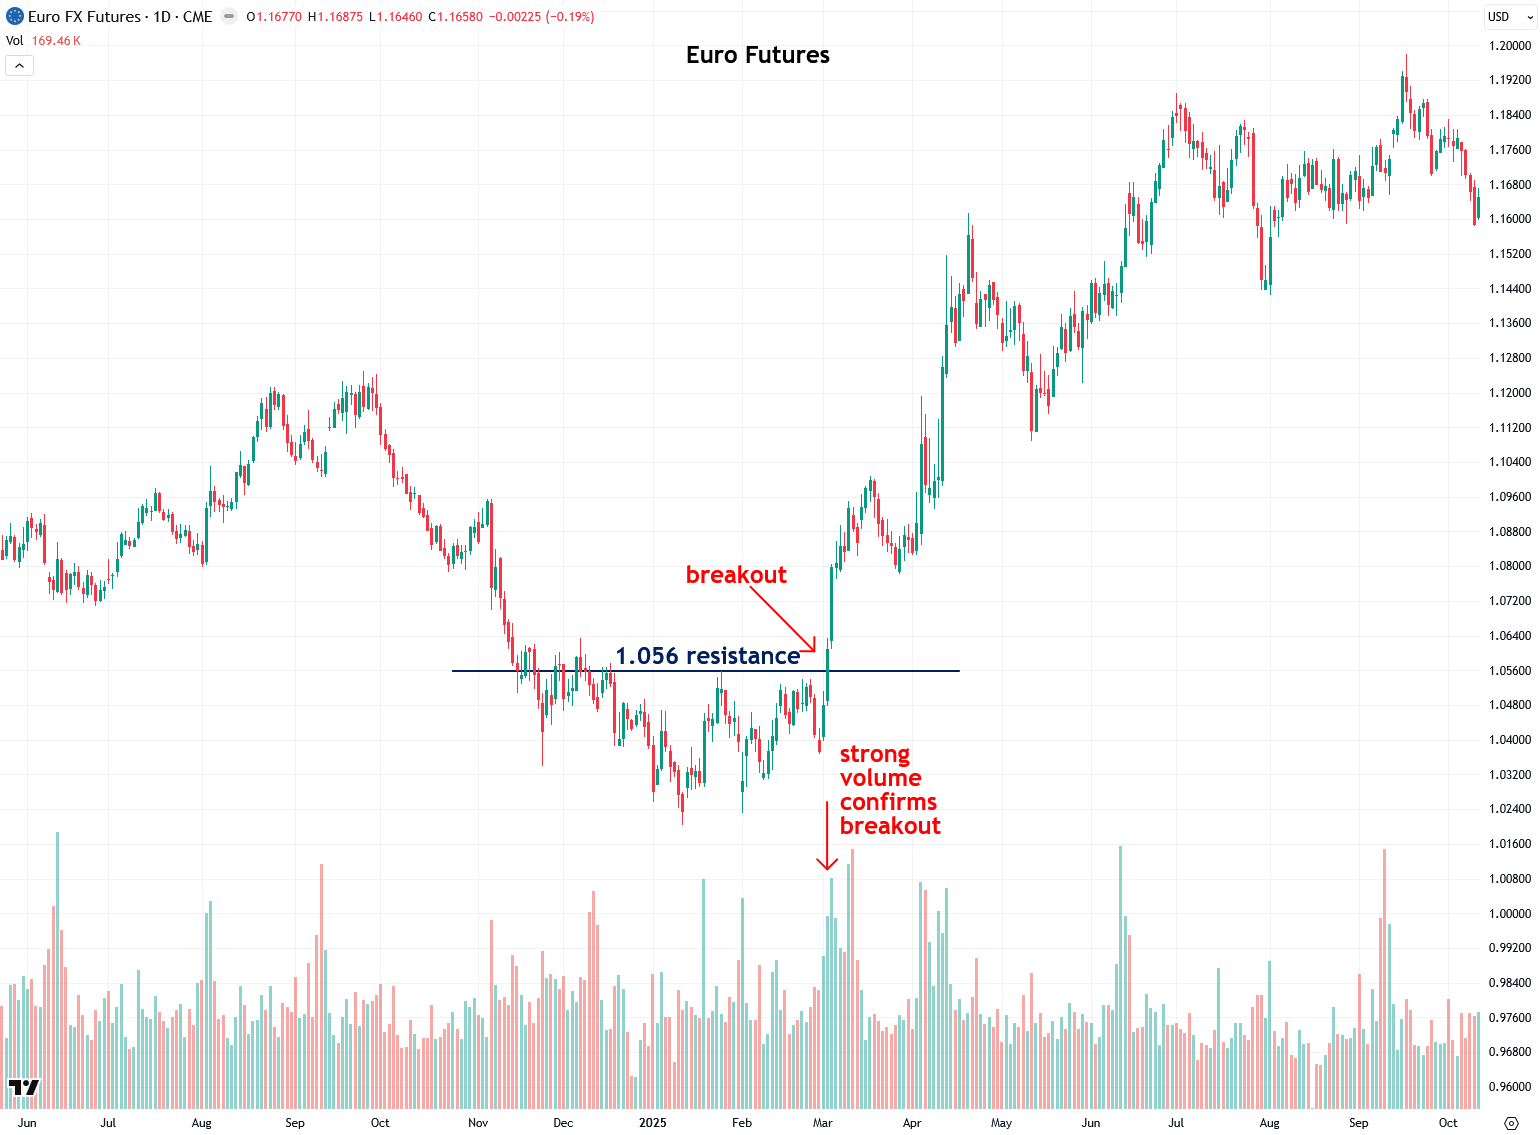
Finally, let’s take a look at euro futures, which broke out above the 1.056 resistance level on heavy volume this past March and continued to rally into the fall.
Now that we’ve looked at several examples of successful breakouts confirmed by strong volume, I want to show you some cases where breakouts occurred with little volume behind them and quickly fizzled out. In some of these instances, the asset sank shortly afterward, although that is not always the case when a breakout fails.
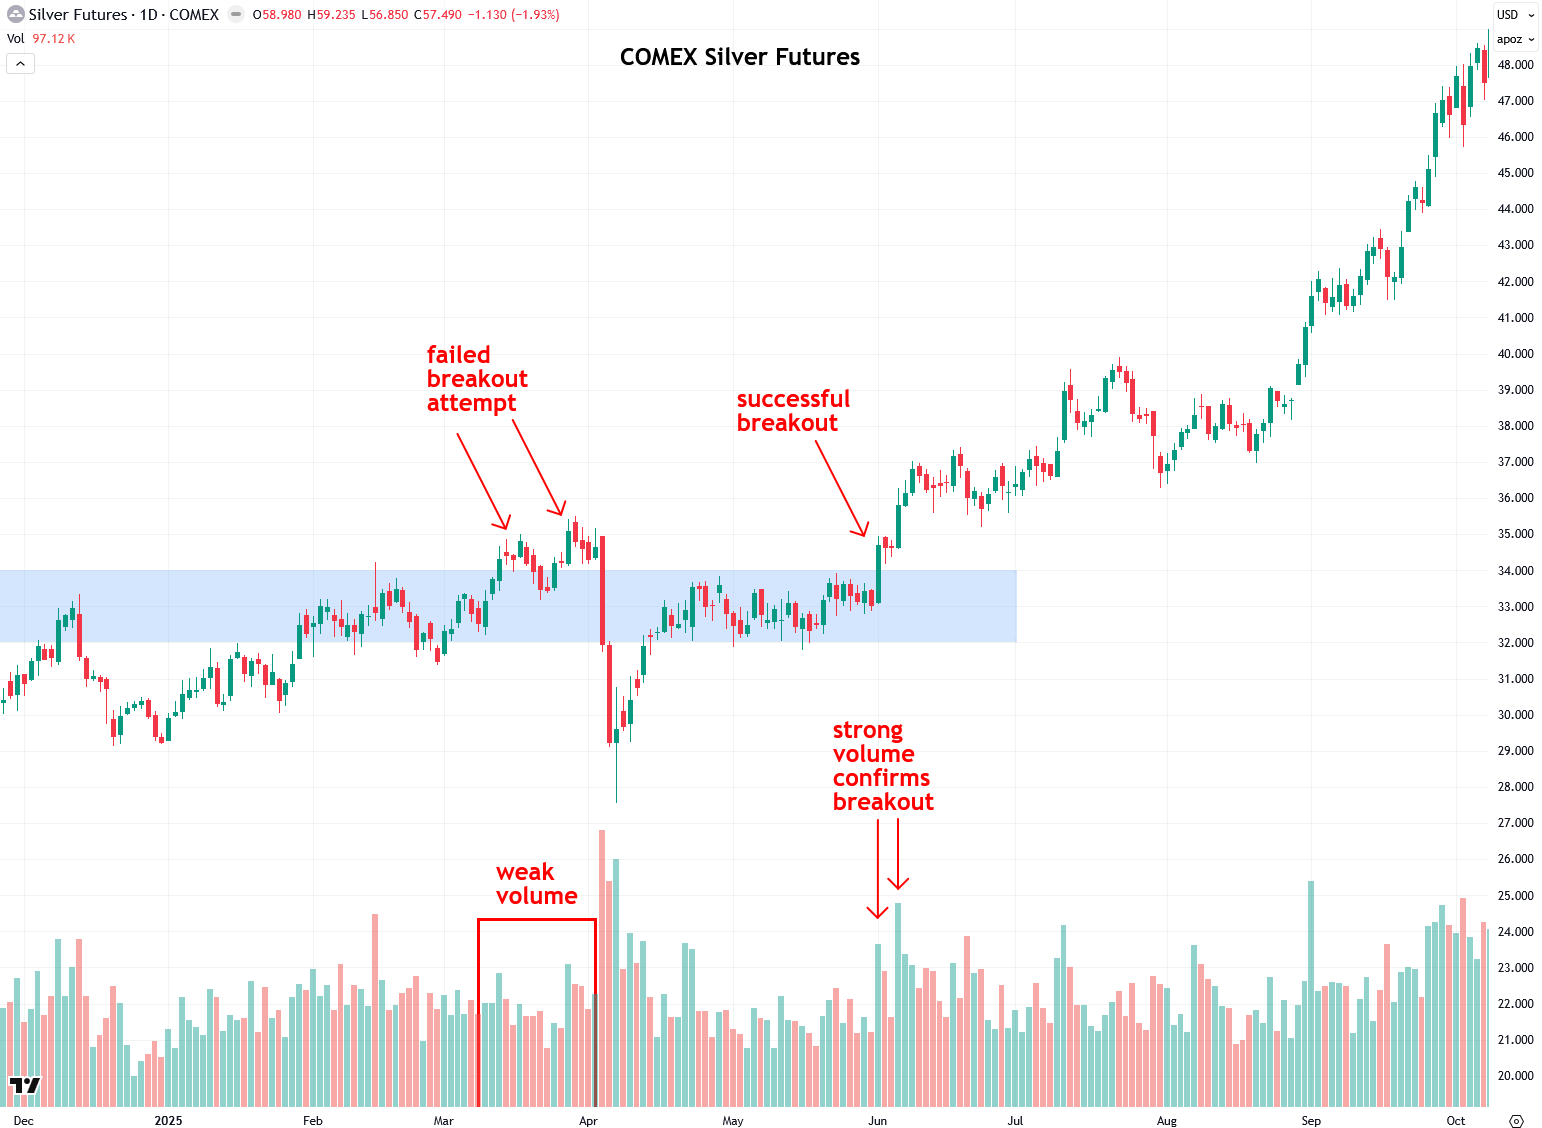
The first example is in COMEX silver futures, which attempted a breakout in March 2025 above the $32 to $34 resistance zone that had capped gains over the prior year. However, the breakout occurred on low volume and quickly failed, sinking shortly afterward. The move was exacerbated by the Trump administration’s ‘Liberation Day’ tariff announcement, which roiled global financial markets at the time.
Interestingly, just two months later, silver made another attempt to break out above the $32 to $34 resistance zone, but this time on strong volume. Not surprisingly, the breakout succeeded, kicking off a rally that continues to this day as silver approaches $60 an ounce.
It’s helpful to see those two breakout attempts so close together: one that failed on low volume and another that succeeded on high volume, clearly illustrating the key lessons of this tutorial.
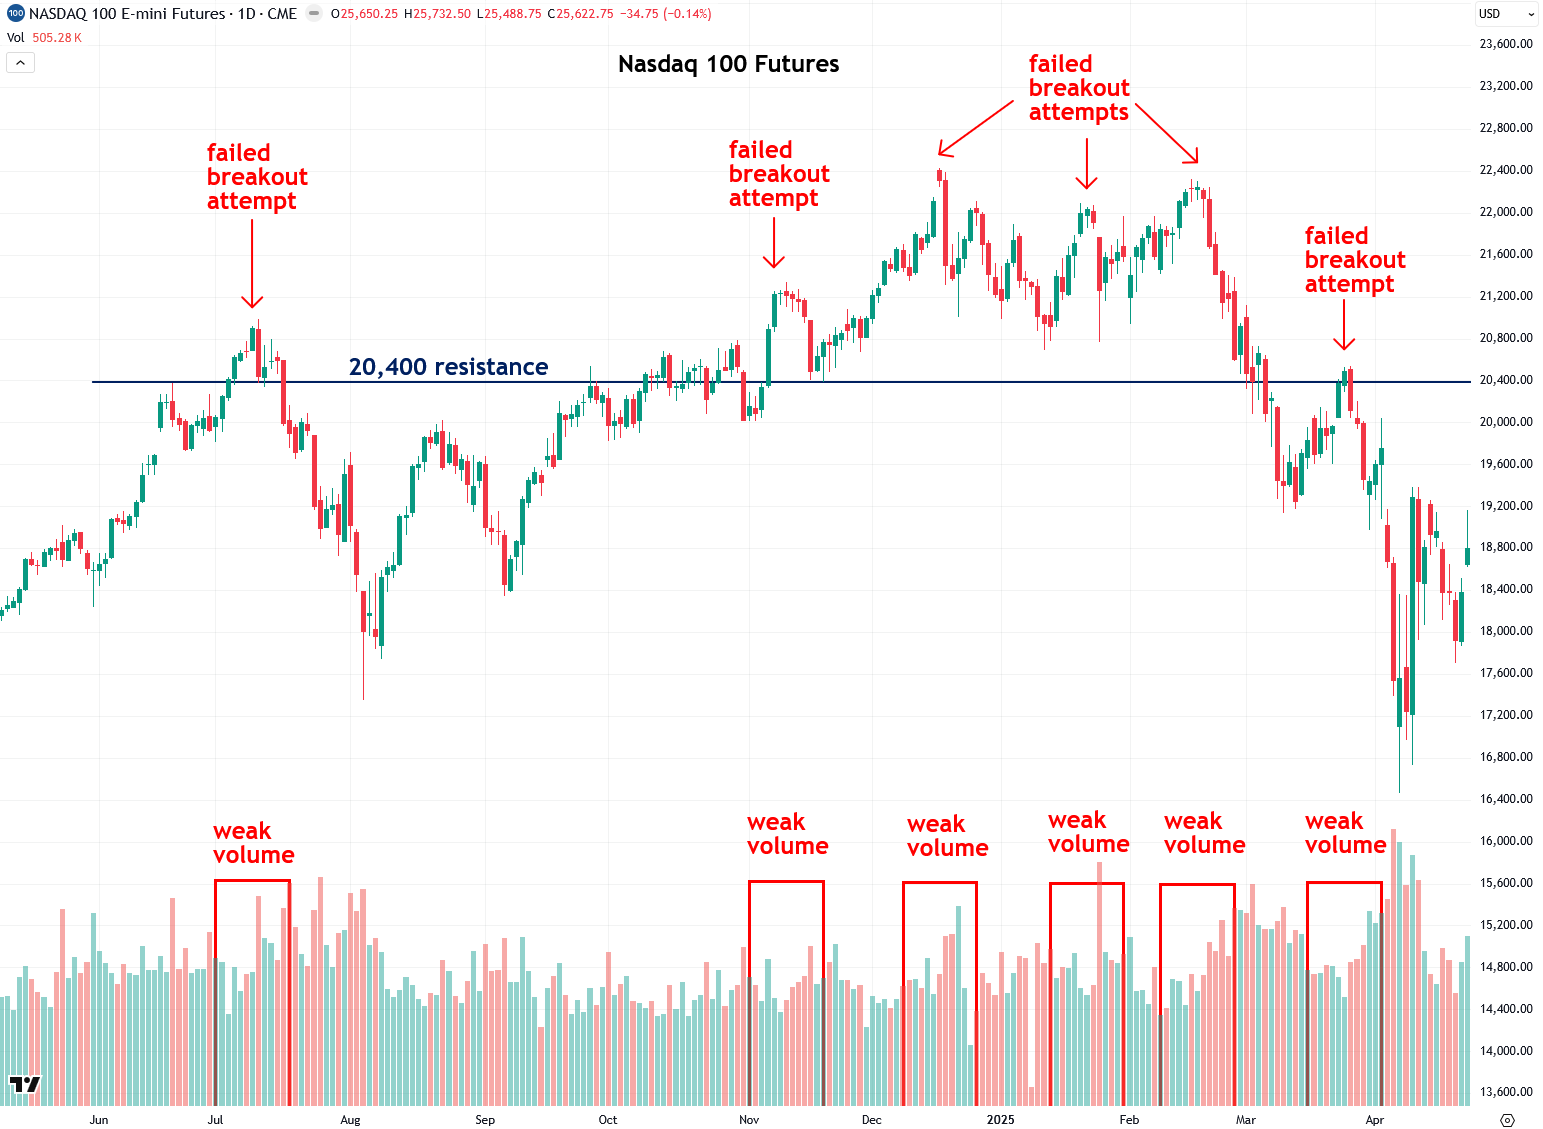
Another example of a failed breakout, or rather several, comes from the Nasdaq 100 futures between spring 2024 and spring 2025. During that time, the Nasdaq repeatedly struggled with the 20,400 resistance level. The first breakout attempt came in July 2024 on low volume and failed. A second attempt in November, also on low volume, met a similar fate.
From December through February, there were three more pushes toward new highs, but each lacked convincing volume and failed to gain traction. Without strong buying interest behind these moves, the market simply didn’t have the fuel to continue higher.
As a result, after months of unsuccessful attempts, the Nasdaq began to sink under its own weight in February 2025 and went on to plunge a hefty 26% in just over a month. It’s also worth noting that during the correction, there was one final attempt to break back above the 20,400 level. However, it occurred on such feeble volume that failure was practically inevitable, and it led to even further downside.
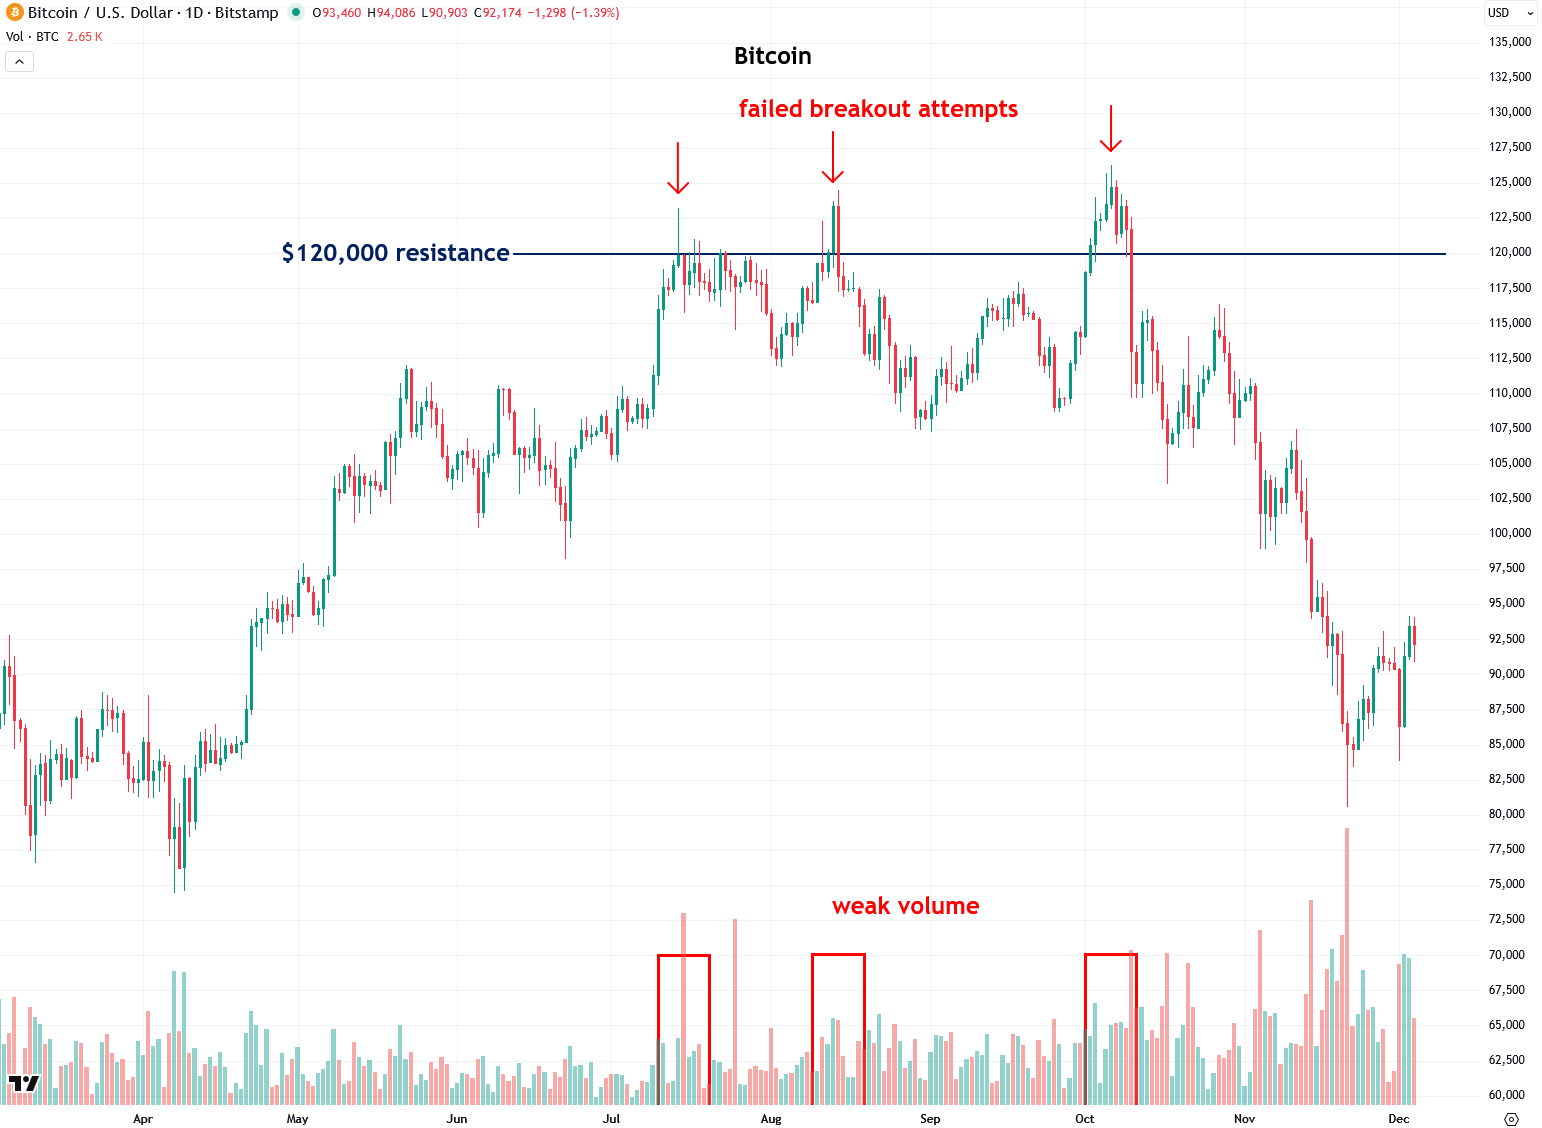
Bitcoin also displayed a similar pattern from July to October of this year, with three separate breakout attempts above the key $120,000 resistance level. However, each attempt occurred on weak volume and lacked any follow-through, leaving Bitcoin starved of the fuel needed to sustain a breakout.
As a result, it eventually sank under its own weight, leading to the recent plunge to just over $80,000. The sharp drop has caught much of the financial world off guard and is now dominating headlines across the media.
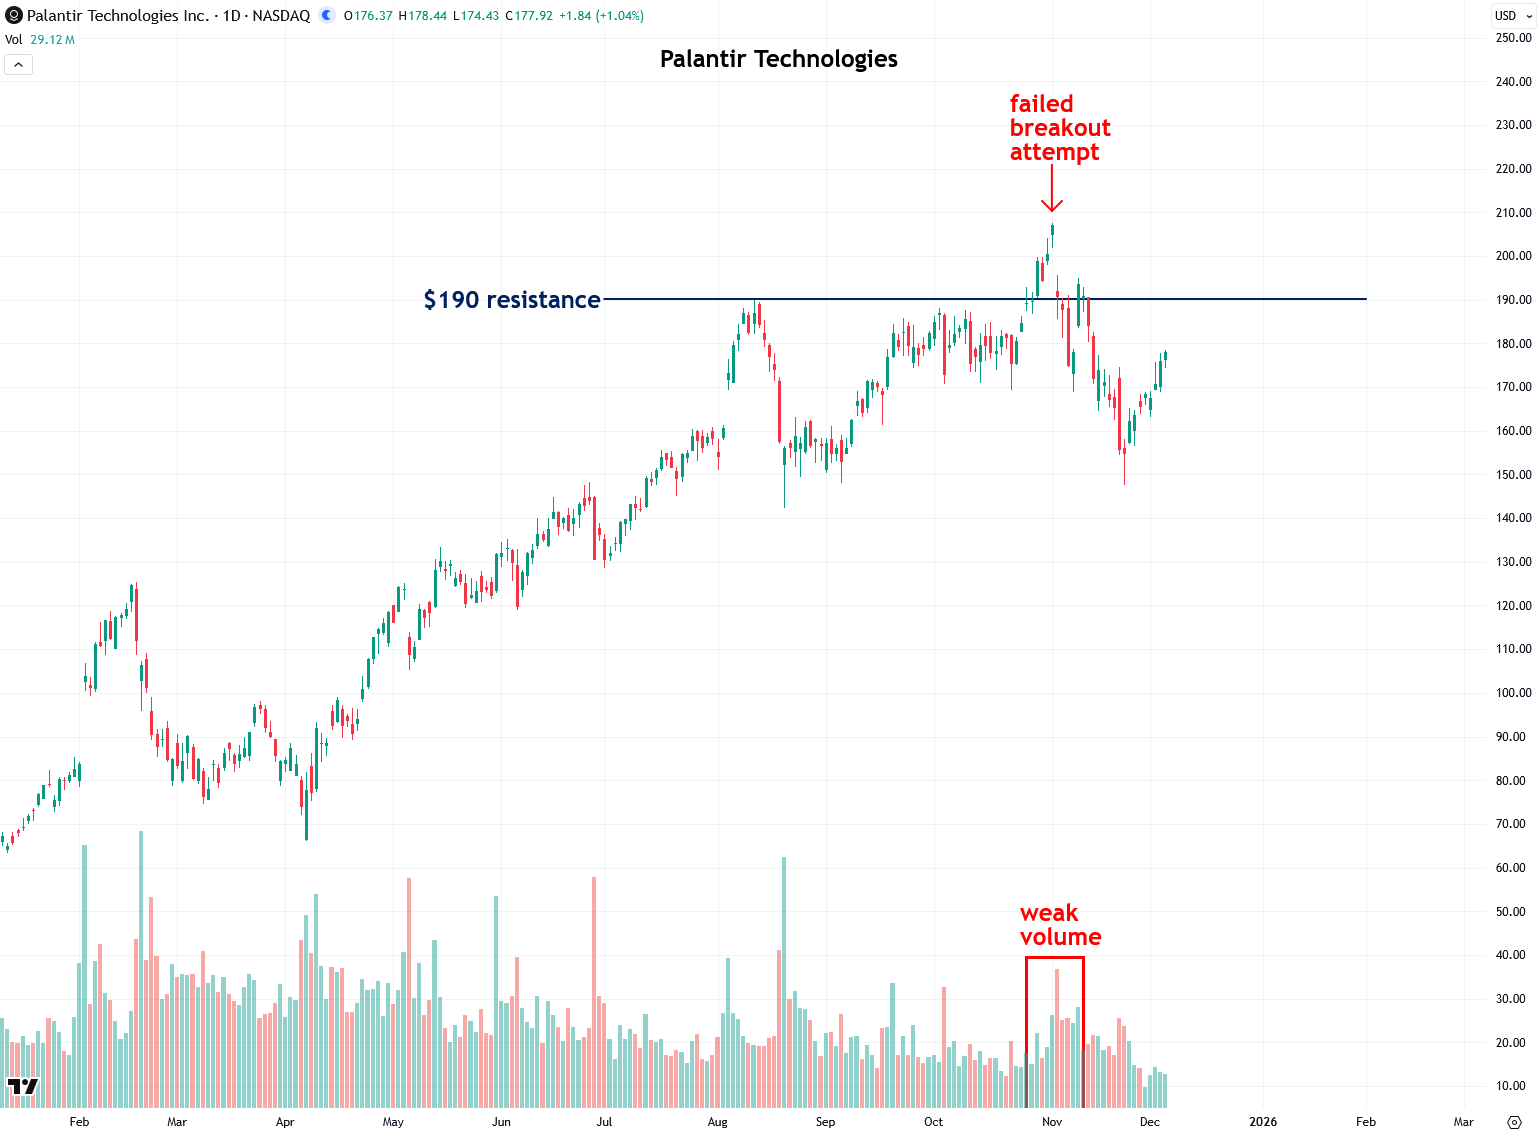
Finally, let’s take a look at one of today’s tech darlings, Palantir Technologies (PLTR). Over the past summer, the stock was struggling to break above the $190 resistance level. It finally staged a breakout in late October, but there was very little volume to support the move.
As a result, the breakout failed, and the stock sank from around $208 to as low as $148 in less than a month. This sharp drop also greatly contributed to the recent turmoil in tech stocks.
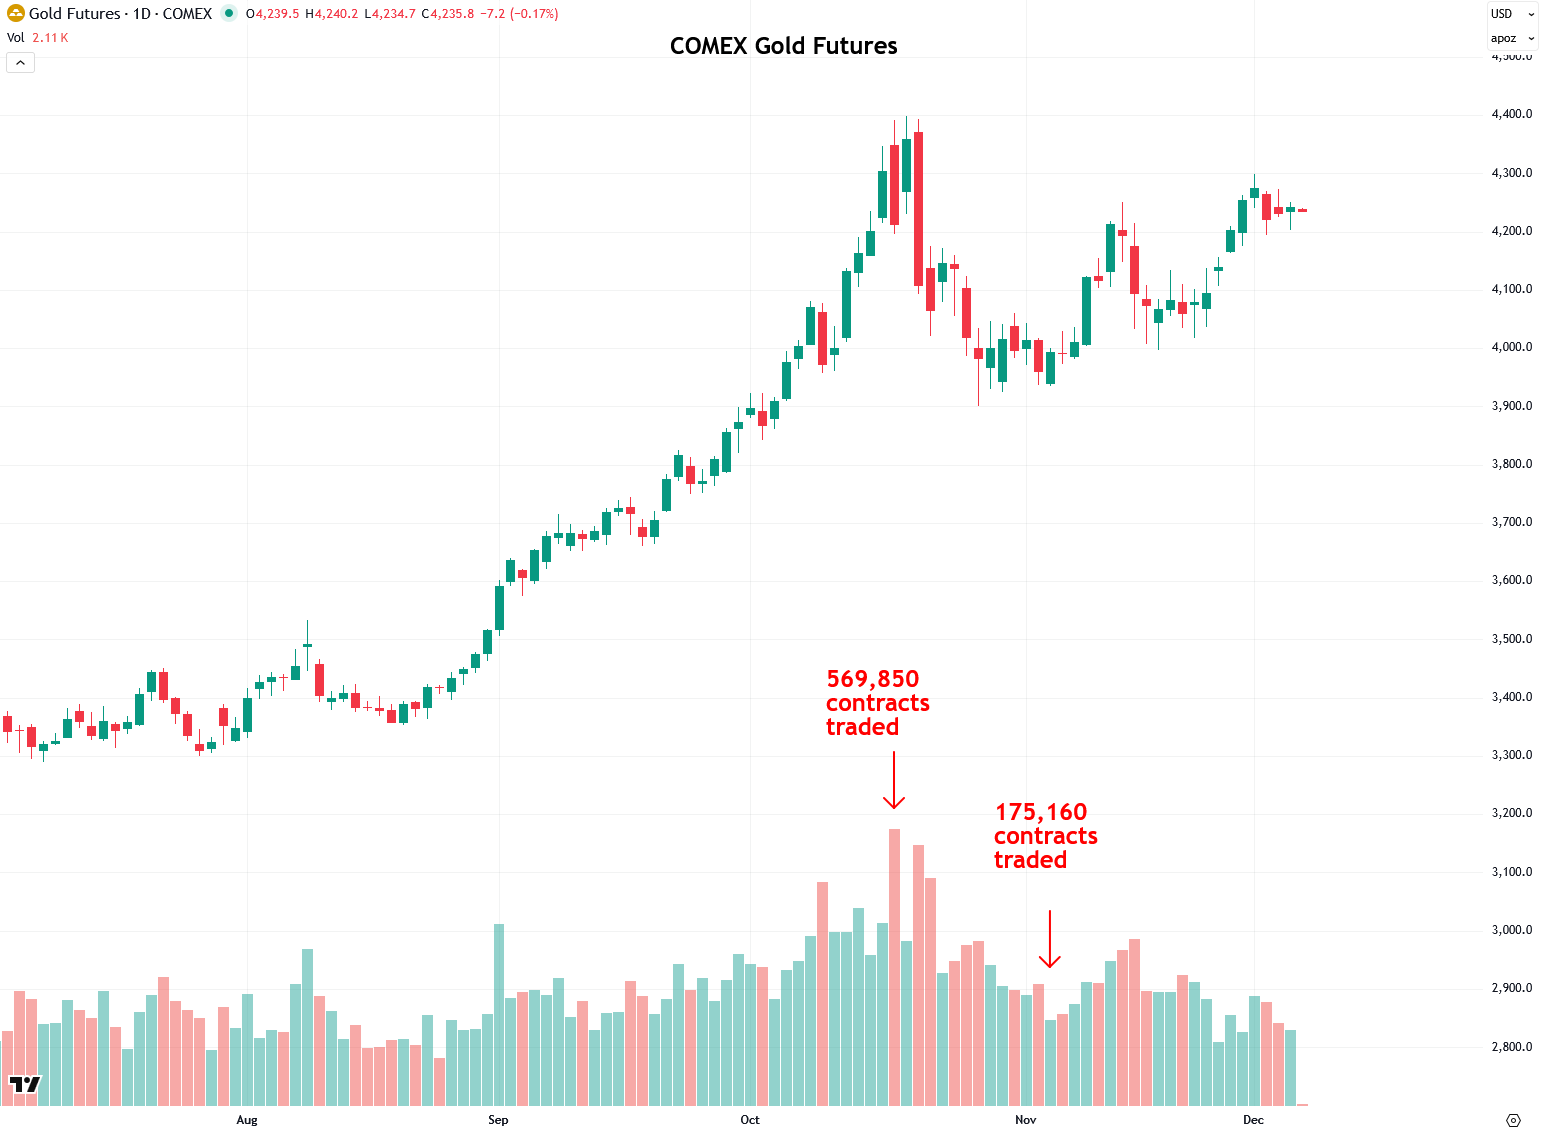
Now that we’ve finished today’s lesson, I want to apply those principles to analyze the recent breakouts in gold and silver, with a focus on volume, starting with COMEX gold futures. As I’ve mentioned in recent updates, gold broke out of a triangle pattern last week, but there wasn’t enough volume to confirm that this is the real or ultimate breakout.
This doesn’t indicate anything bearish, negative, or alarming. It simply means we need to wait for a strong bullish move supported by heavy volume, ideally sustained over multiple days, to confirm that the next leg of the rally has begun. Until that happens, gold is likely to continue meandering, as it has since breaking out of the triangle.
I am also closely watching for a high-volume breakout above the $4,400 resistance level that formed at the October peak for full confirmation. Breakouts above horizontal resistance levels are typically more meaningful and reliable than those above diagonal resistance levels, such as the downtrend line of the triangle pattern. Once gold breaks out of the recent consolidation, it is likely to rally past $5,000 fairly quickly, as I have explained in this piece.
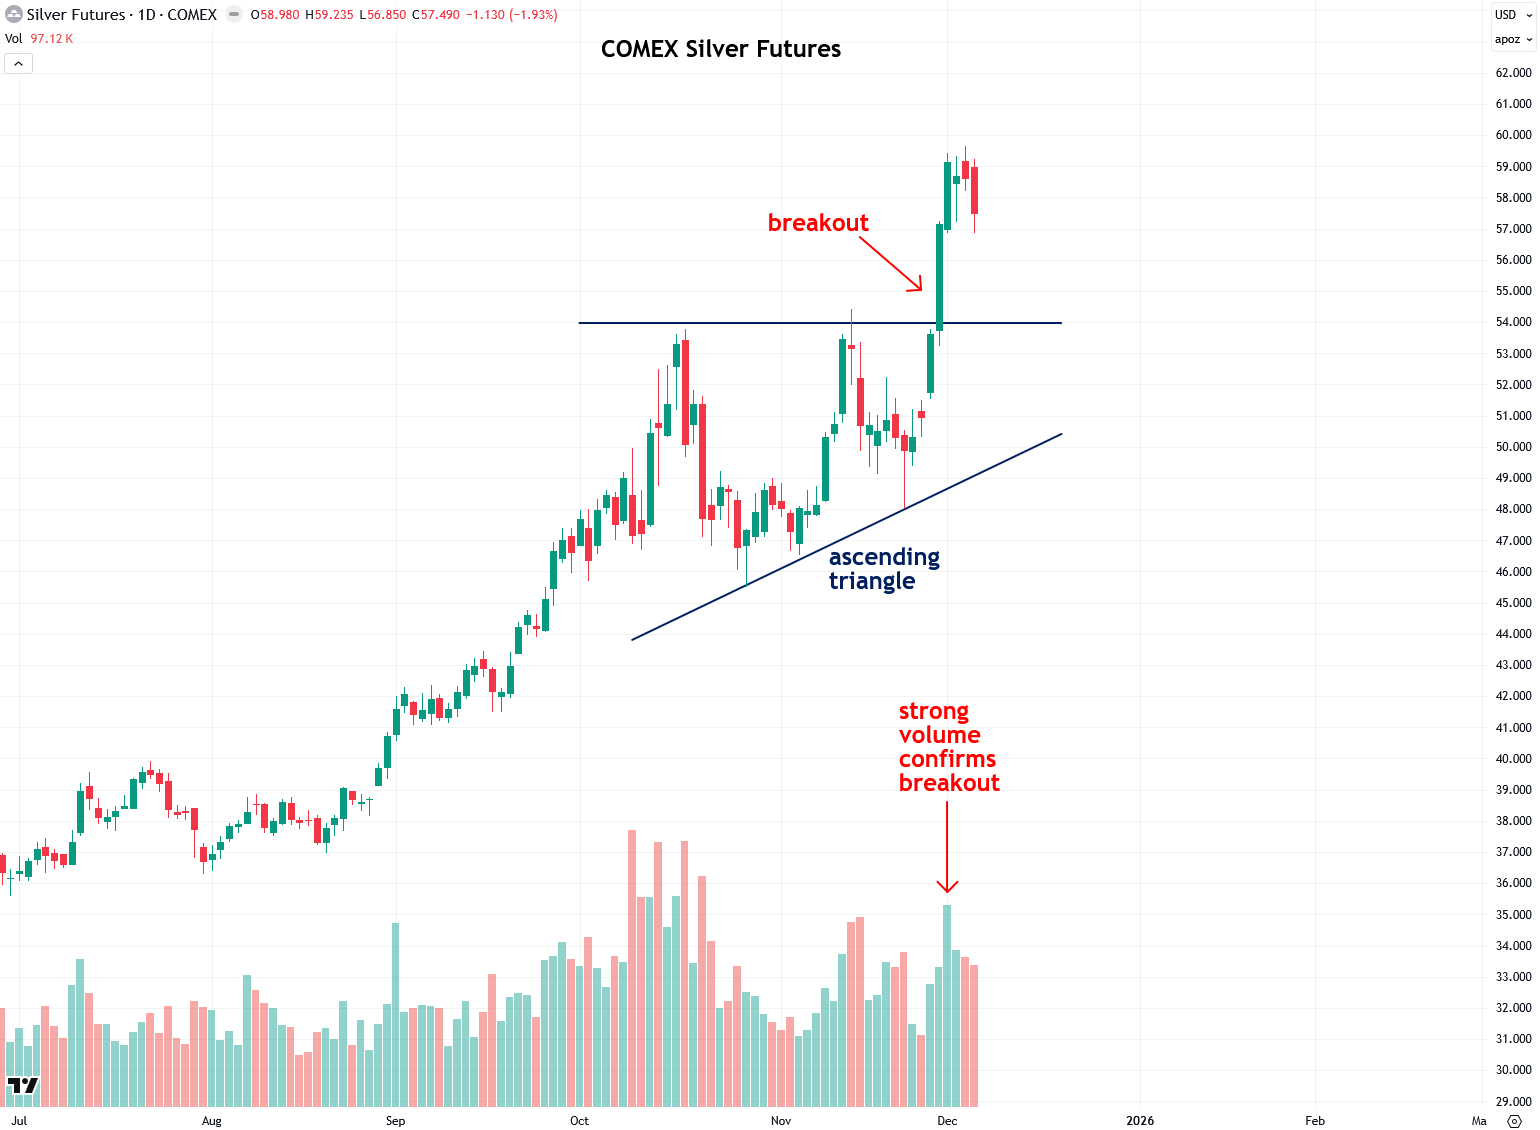
Next, let’s look at COMEX silver futures, which are in a much stronger and less ambiguous technical position than gold. That’s because silver broke out of its ascending triangle pattern, including the horizontal $54 resistance level, on strong volume. This is especially notable given that the breakout occurred the day after Thanksgiving, a shortened trading session when volume is typically light.
Since the breakout, silver has paused briefly, which is normal and expected after such a sharp, almost vertical move. No asset moves higher every single day. Even in the strongest bull markets, progress typically comes in the form of three steps forward and one step back.
Right now, silver is simply catching its breath on the way to what I believe is a fairly quick move toward $72 as the next immediate target. I’ll be watching for sustained strong volume, reflected in tall green volume bars, to confirm that bullish momentum remains intact.
To summarize, in this tutorial you learned how to use trading volume to confirm breakouts and saw many examples of successful breakouts that had strong volume behind them, as well as other examples of breakouts that fizzled out because they didn’t have enough volume behind them for confirmation.
Though financial institutions (the “smart money”) typically don’t say what they are doing in the financial markets, they are too big to hide their activities, which can clearly be seen in trading volume. This is why it is important to keep an eye on volume and know how to interpret it in addition to paying attention to price action. I hope you will now view the financial markets with new eyes and will improve your trading and investing through this simple yet powerful technique.
Now that you’ve finished this tutorial, I recommend checking out the other ones I’ve written over the past year as well:
- Support & Resistance Zones Explained – Part 1
- Support & Resistance Zones Explained – Part 2
- A Simple Yet Powerful Technique for Identifying Trends
- When to Buy Dips and Sell Rips
If you’ve enjoyed this tutorial or have any questions, comments, or thoughts, please give this post a like and share your thoughts in the comments below—I’d love to start a conversation and hear your perspective.
Disclaimer: the information provided in The Bubble Bubble Report and related content is for informational and educational purposes only and should not be construed as investment, financial, or trading advice. Nothing in this publication constitutes a recommendation, solicitation, or offer to buy or sell any securities, commodities, or financial instruments.
All investments carry risk, and past performance is not indicative of future results. Readers should conduct their own research and consult with a qualified financial advisor before making any investment decisions. The author and publisher disclaim any liability for financial losses or damages incurred as a result of reliance on the information provided.