
Anyone who has been a subscriber for more than a couple of months knows that, in addition to precious metals, I am also a copper bull, and I periodically check in on it to see how it is doing. I am very interested in the bullish thesis for copper on its own as an investor (learn more), and it also has the added benefit of giving useful signals for silver (learn more).
A bull market in copper, which I expect, should also supercharge silver’s bull market, which is a win-win in my book. Thankfully, copper has been on a tear lately, so I wanted to give an update on the situation and reiterate why I believe it is about to seriously amplify silver’s bull market as well.
So let’s take a look at what’s happening in the chart of Grade A copper futures traded on the London Metal Exchange (LME). I prefer following that contract instead of the more popular High Grade Copper futures traded on the U.S. COMEX exchange, ever since the Trump administration’s bungled tariff announcements this spring caused severe price distortions and made COMEX futures copper virtually useless for technical analysis, as I explained in a previous update. Like COMEX copper, LME copper futures are priced in U.S. dollars, but quoted per metric tonne rather than per pound.
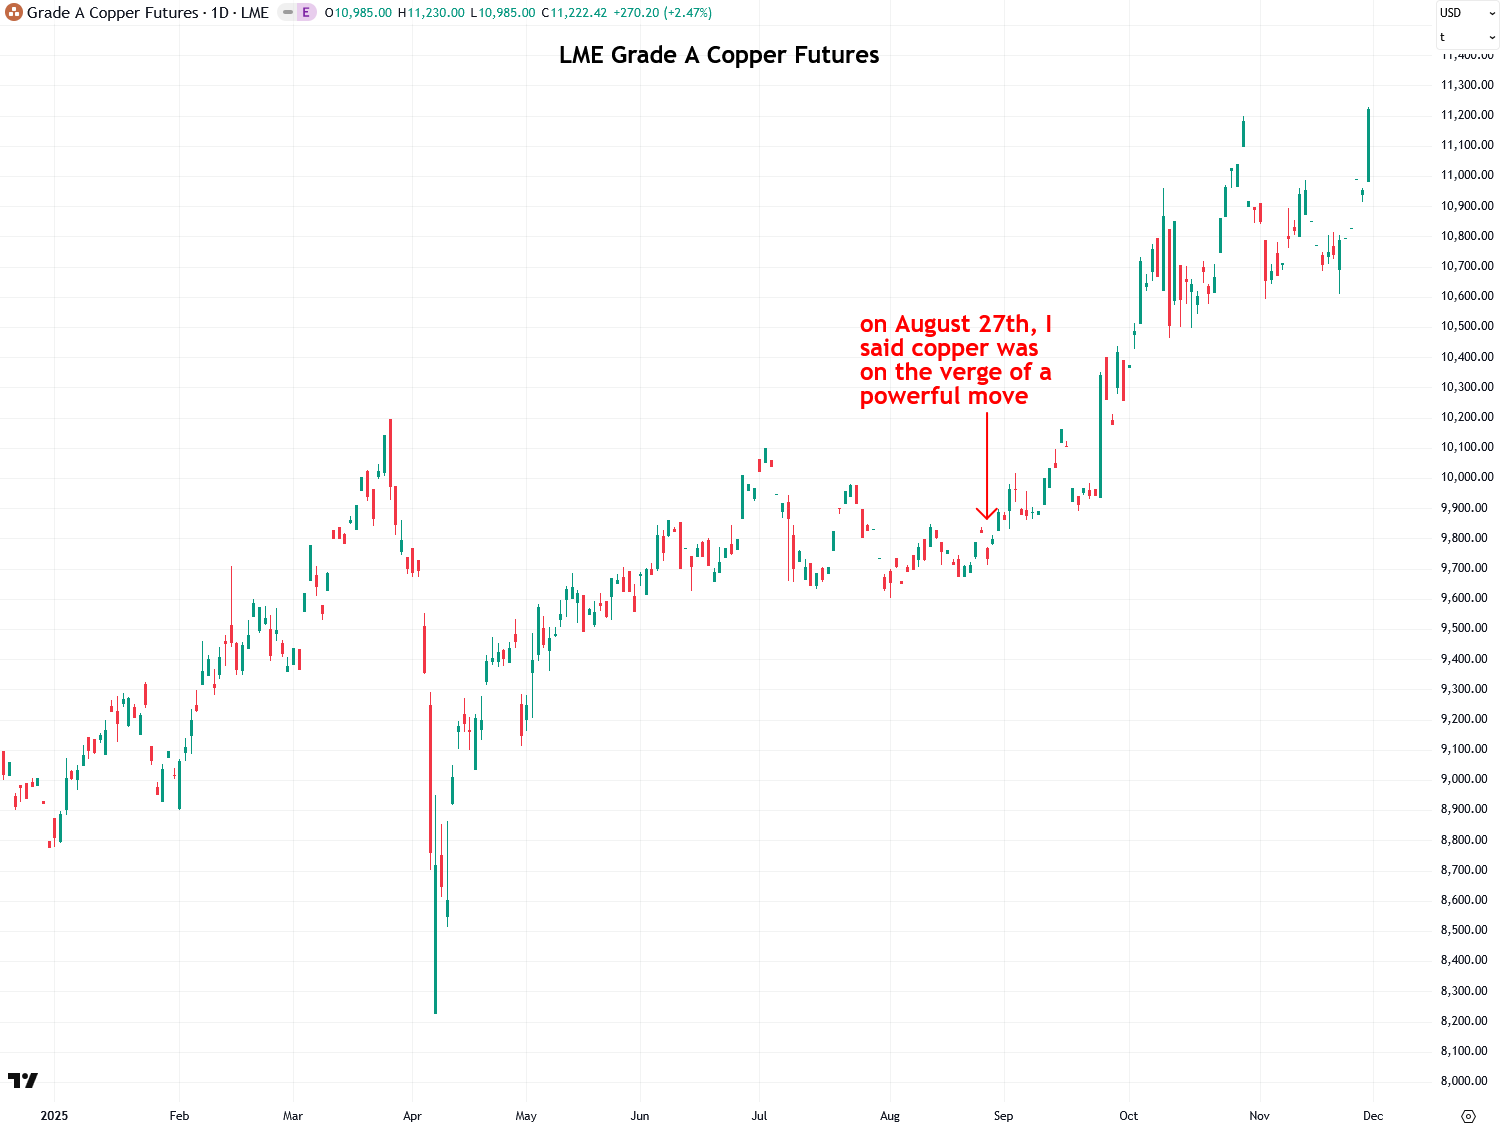
Back on August 27th, I published a report highlighting a volatility squeeze in copper, which I anticipated would lead to a significant move in both copper and silver. Over the past three months, that scenario has played out perfectly, with copper surging to a new all-time high of $11,222 per tonne on Friday. In my view, this move is only just beginning. There are several factors driving copper’s recent breakout, and I’ll dive into those later in the report, after covering the technical analysis portion.
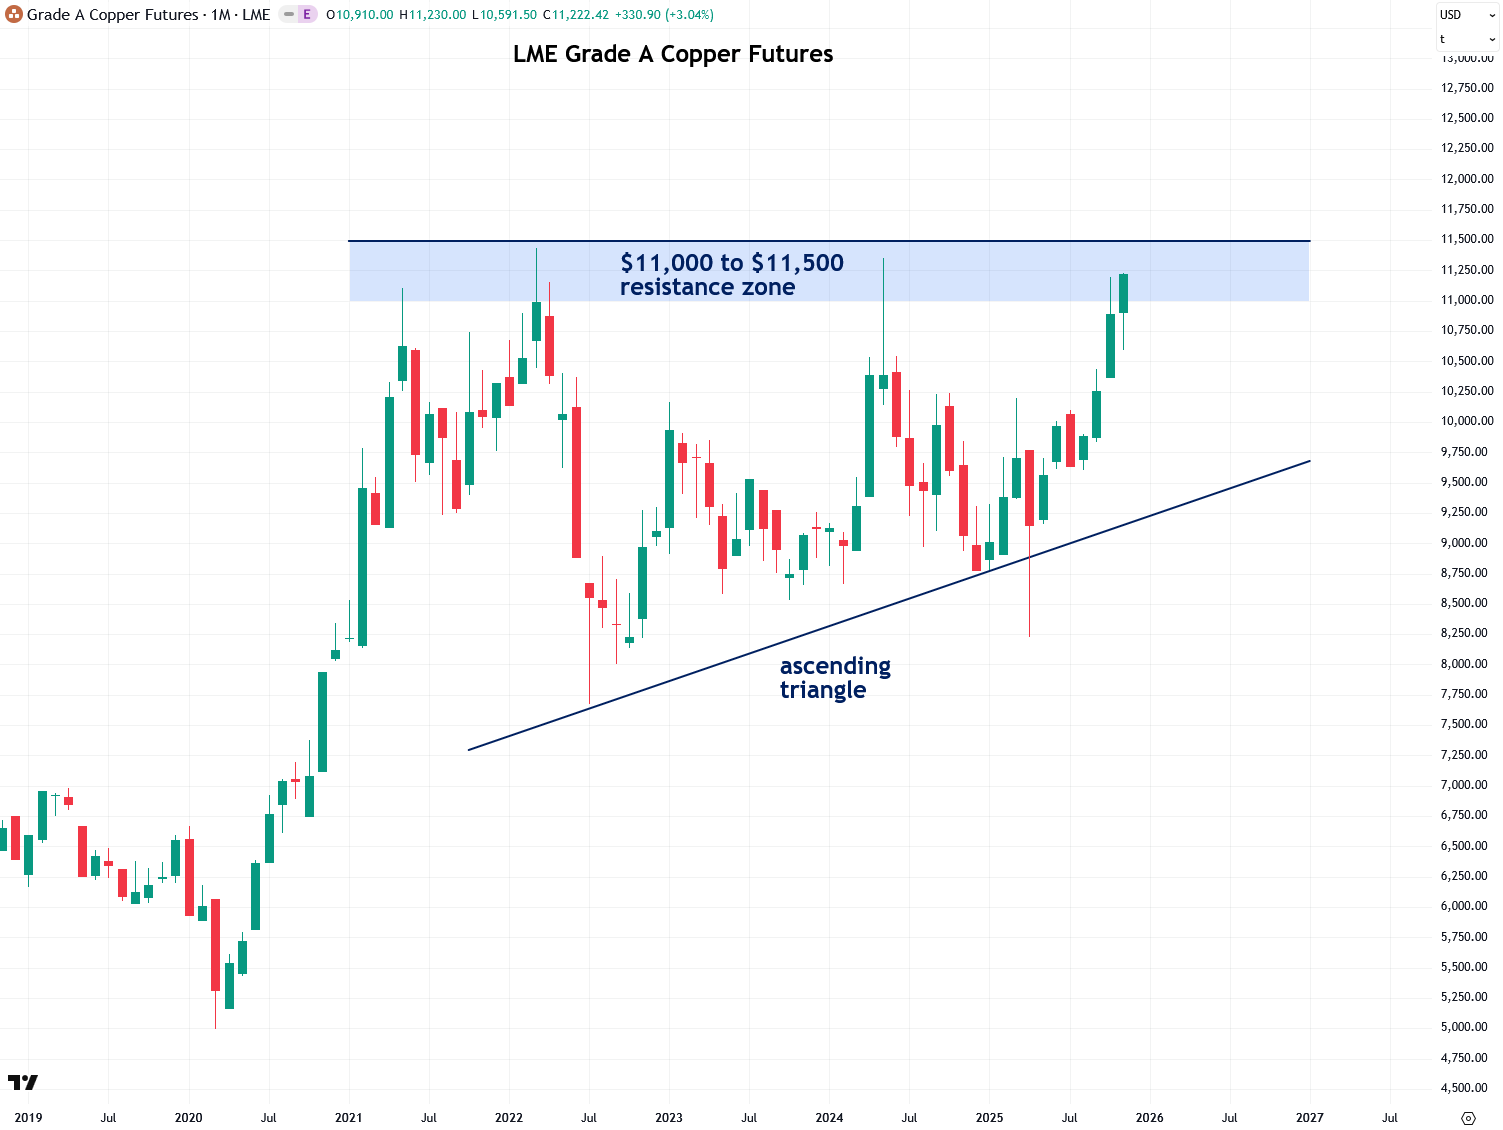
Looking at the longer-term monthly chart of copper, we can see it has been forming an ascending triangle pattern since 2021 and is now on the verge of breaking out. The key level I’m watching to confirm this breakout is the $11,000 to $11,500 resistance zone. A strong, high-volume close above that zone would be the signal that the fireworks are about to begin.
To learn more about support and resistance zones, I recommend reading my two-part tutorial on the topic (Part 1 and Part 2).
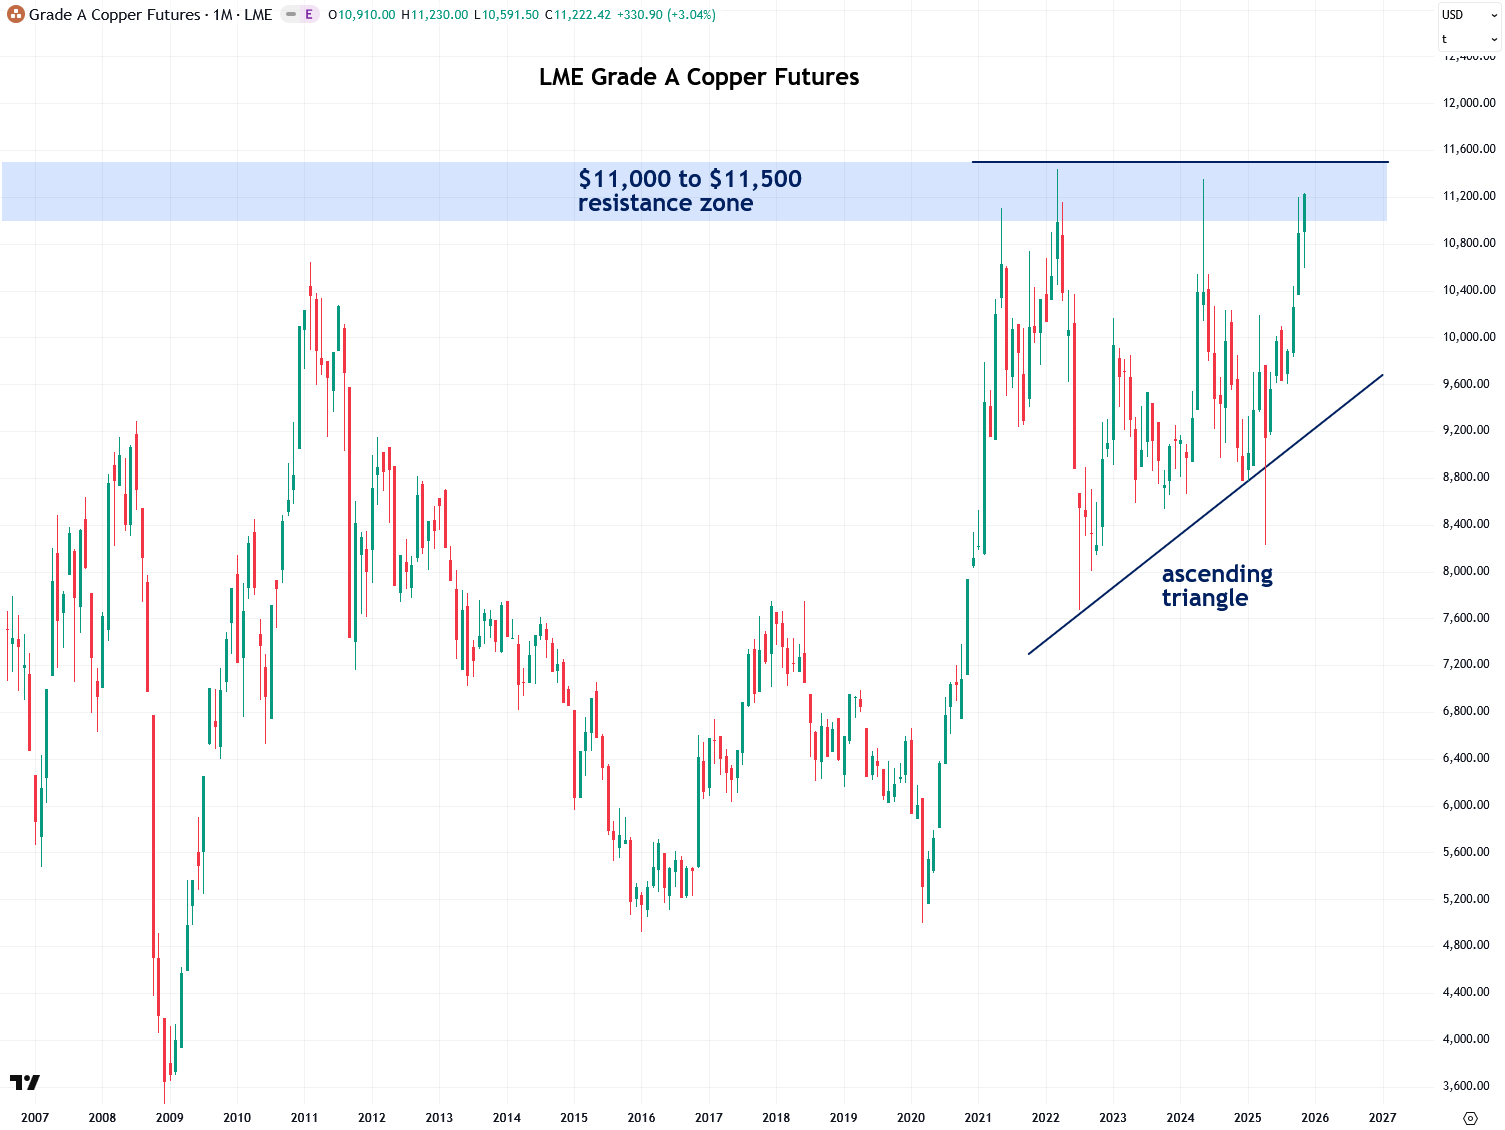
Zooming out to the bigger picture over the past two decades reveals both the ascending triangle and the key $11,000 to $11,500 resistance zone highlighted in the previous chart. I believe that once copper closes decisively above this zone, it will mark the beginning of a truly epic bull market, and I am very excited about what lies ahead.
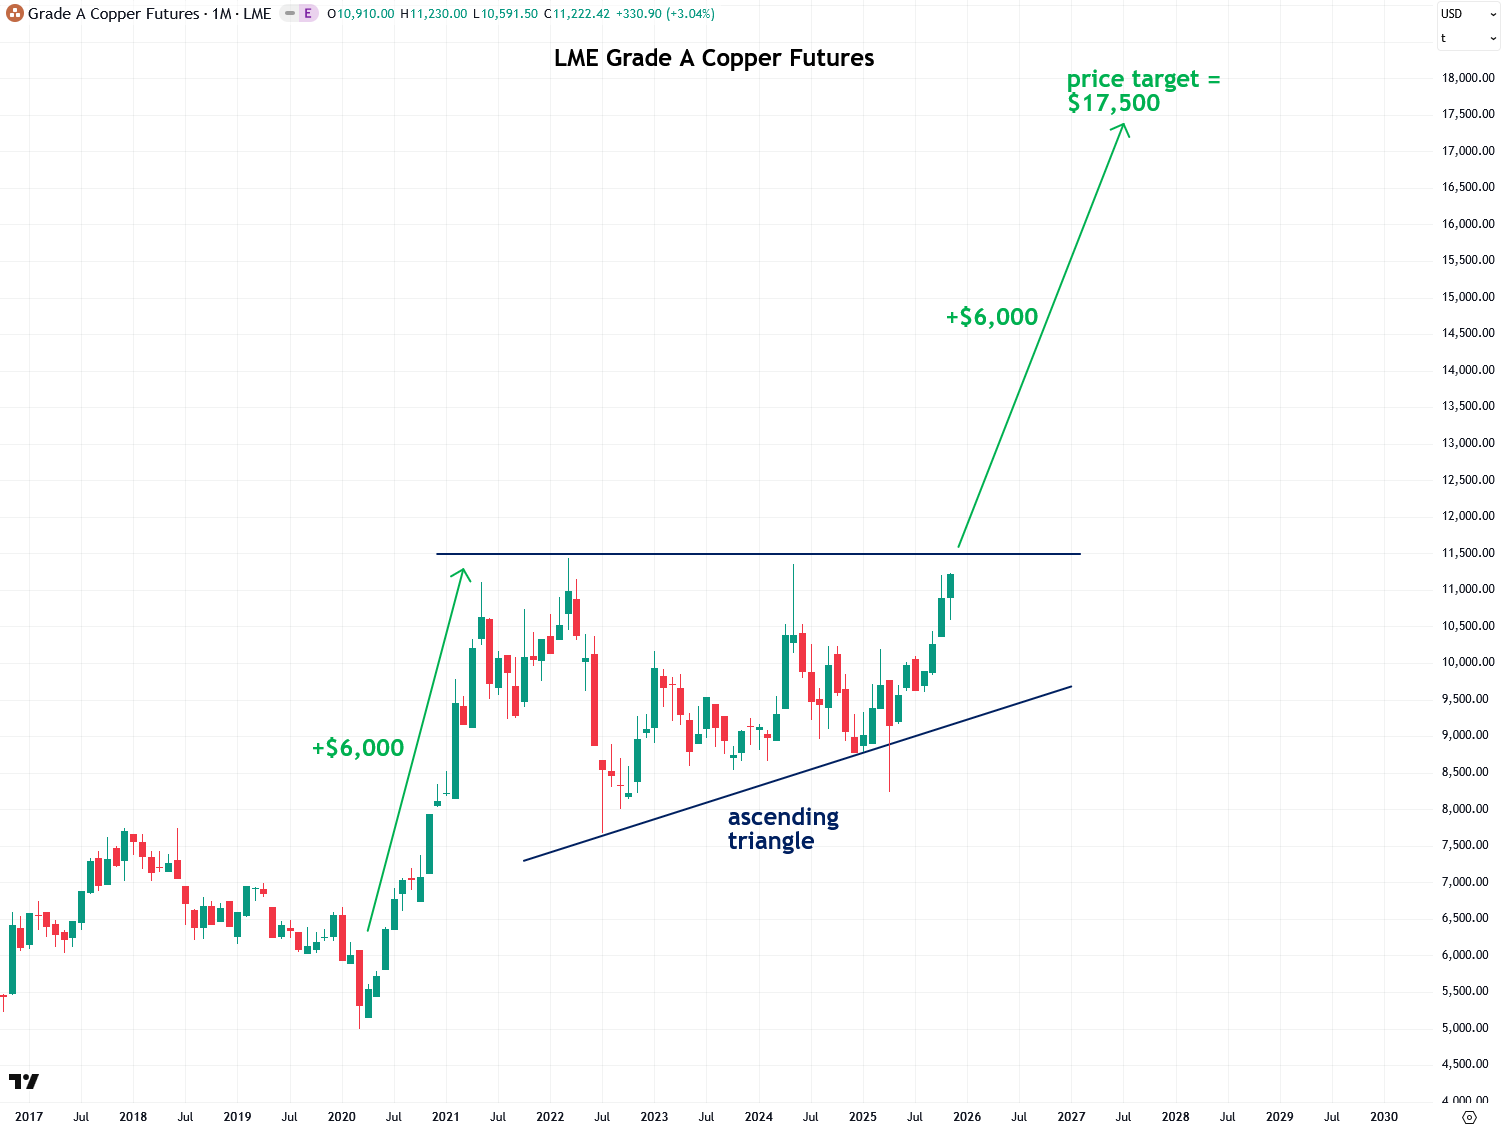
Copper’s ascending triangle pattern allows us to project a price target using a powerful and useful technical analysis method called a measured move. To apply it, we measure the size of the move leading into the pattern, which in this case was $6,000 per metric tonne.
We then project that same amount upward from the top of the pattern, which is $11,500. Adding $6,000 to the $11,500 breakout level gives us a projected target of $17,500 per tonne, representing an impressive 56% gain. That is the minimum price copper is likely to reach after breaking out from its triangle pattern.
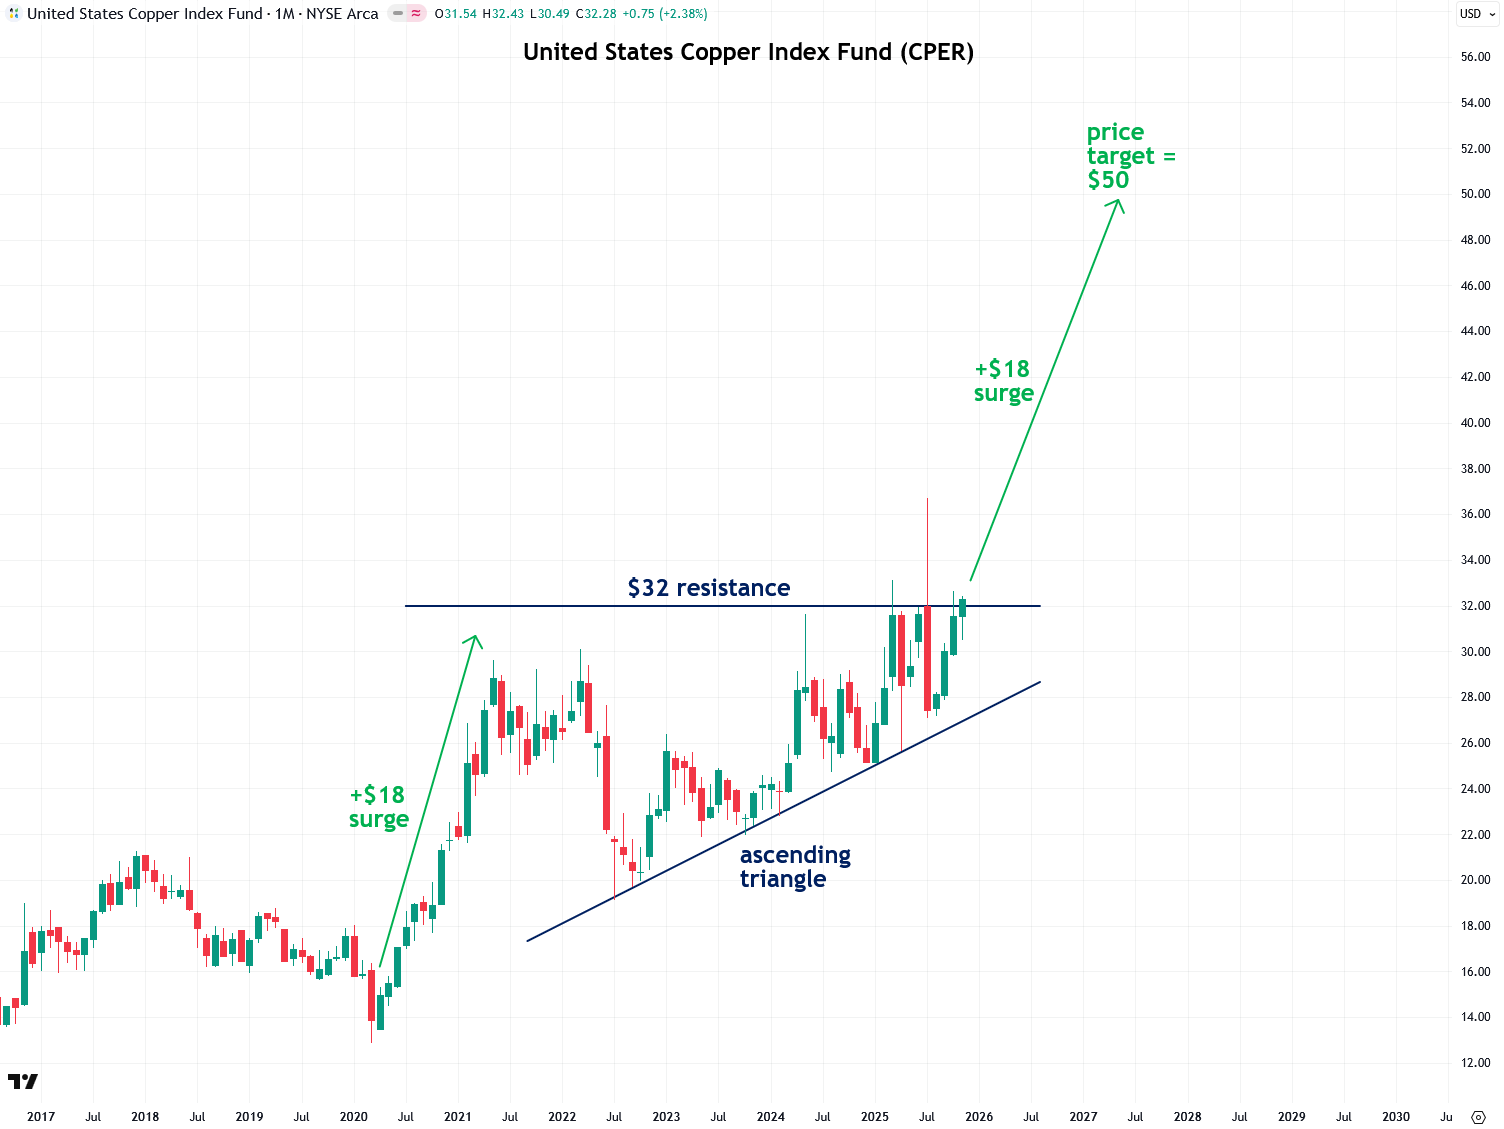
Now let’s look at some ways to play the likely upcoming copper bull market. My preferred approach is to keep it simple and straightforward by using the United States Copper Index Fund, symbol CPER. This fund tracks the price of copper and should generally deliver similar percentage gains. The ascending triangle pattern is visible on CPER’s chart as well, and its measured move projects a price target of $50 from a breakout point of $32, which represents a 56% gain.
The one caveat is that CPER must close decisively above the $32 resistance level and remain above it for the bullish thesis to stay valid. If it were to break out briefly but then close solidly back below that level, that would be my signal to cut losses.
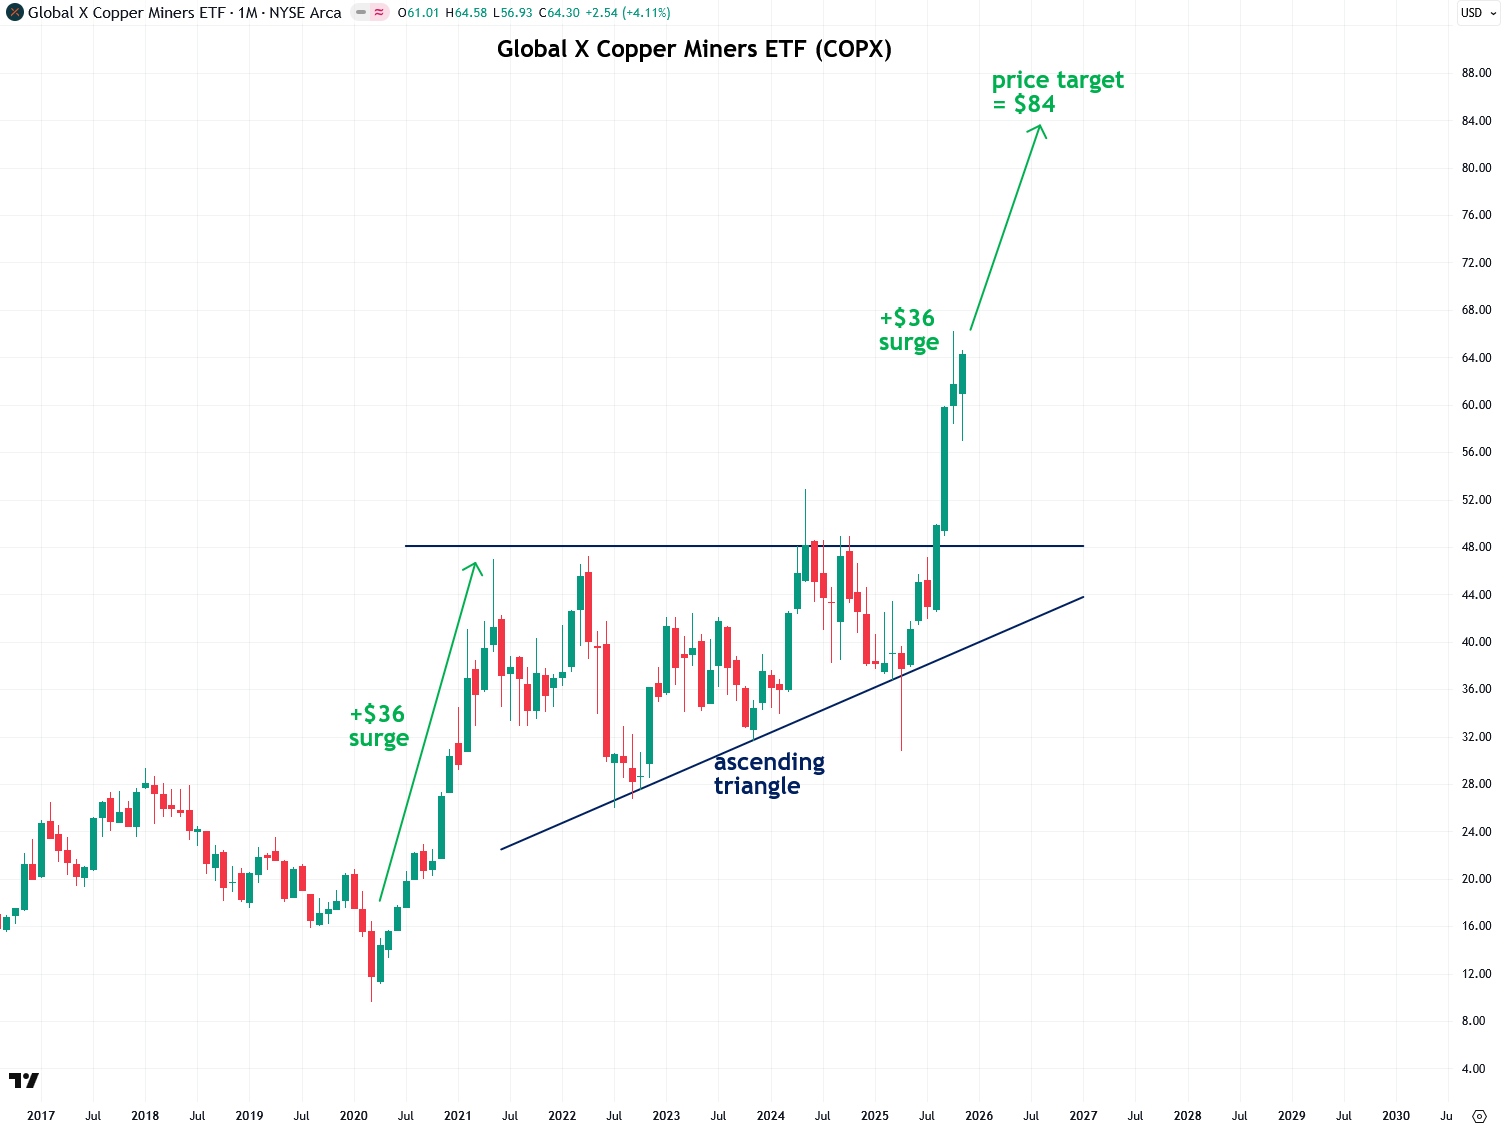
I also like the Global X Copper Miners ETF, symbol COPX, and I alerted subscribers to its bullish setup back in March. Since then, it has broken out just as I expected. I still believe it has room to run and should rise to around $84 based on the measured move principle.
My only reservation is for those who are not already in it. I would avoid chasing it here, since it has already broken out and is now quite extended from its breakout point. That makes it more vulnerable to a short-term pullback. There could still be another opportunity to enter after a pullback or period of consolidation, however.
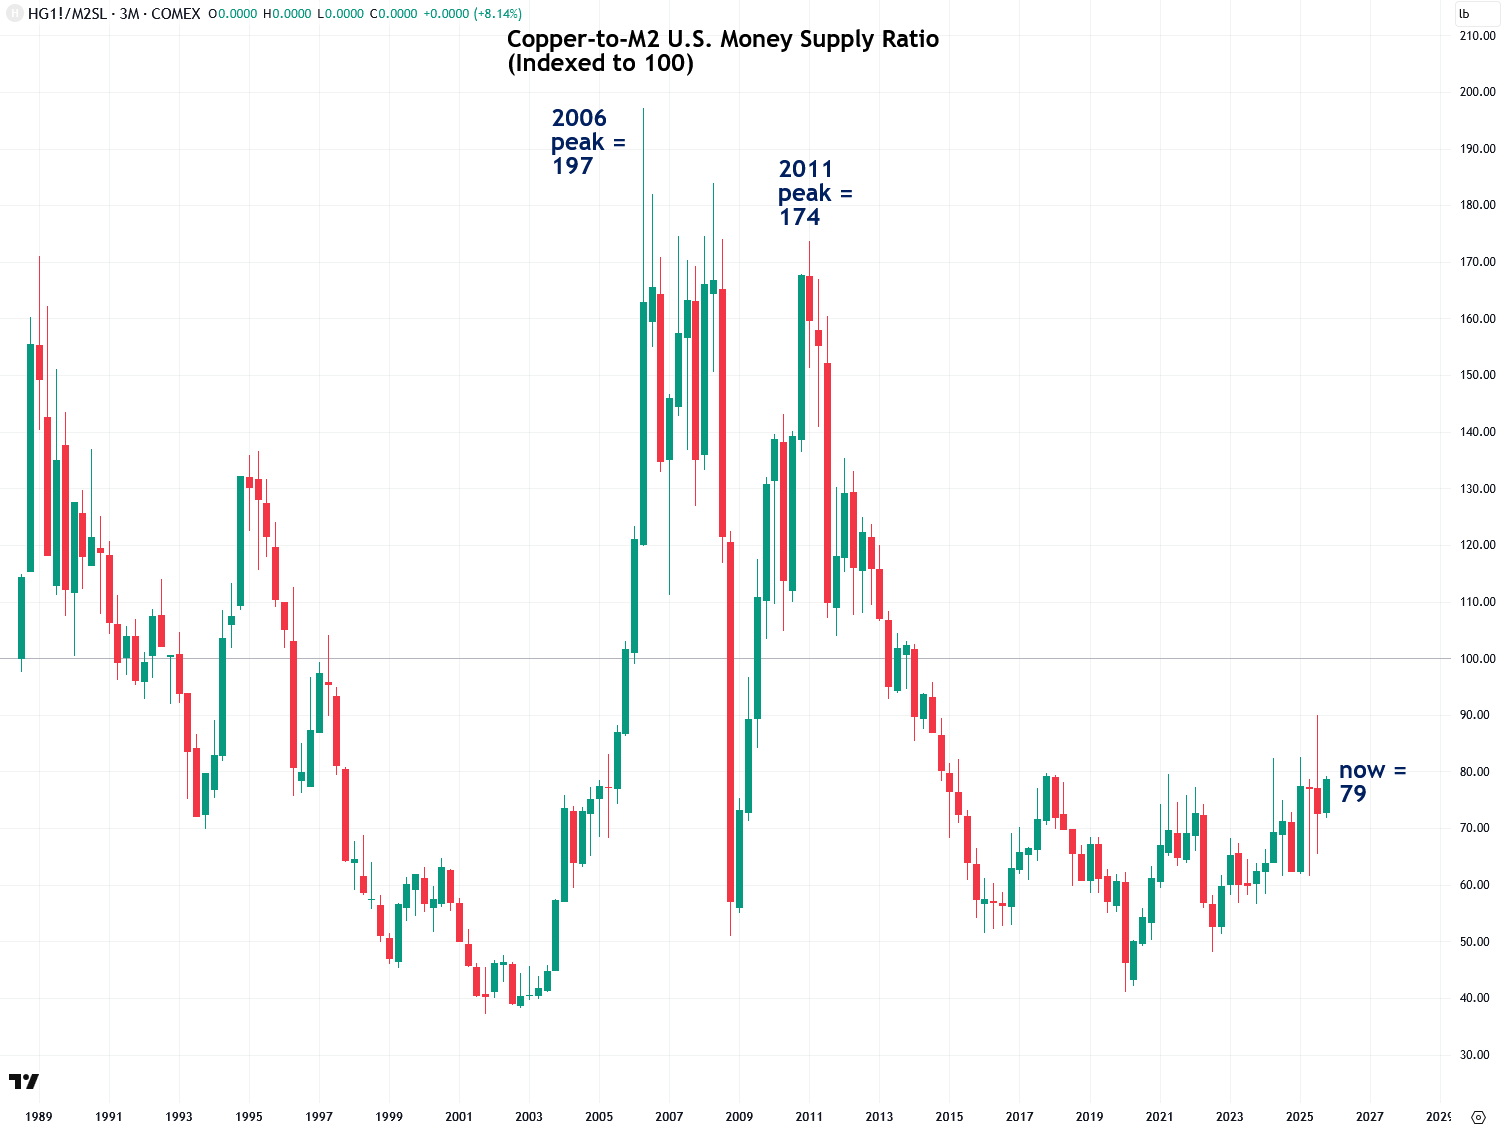
From a valuation perspective, copper remains quite cheap when measured against several different yardsticks, as I explained in a recent report. This indicates that copper has significant room to rise from current levels.
For example, the chart below shows the ratio of copper to the U.S. M2 money supply, indexed to 100. The current index value is just 79, compared to prior peaks of 197 in 2006 and 174 in 2011. While copper may be at an all-time high in nominal terms, it is not in real terms, and that is what truly matters.
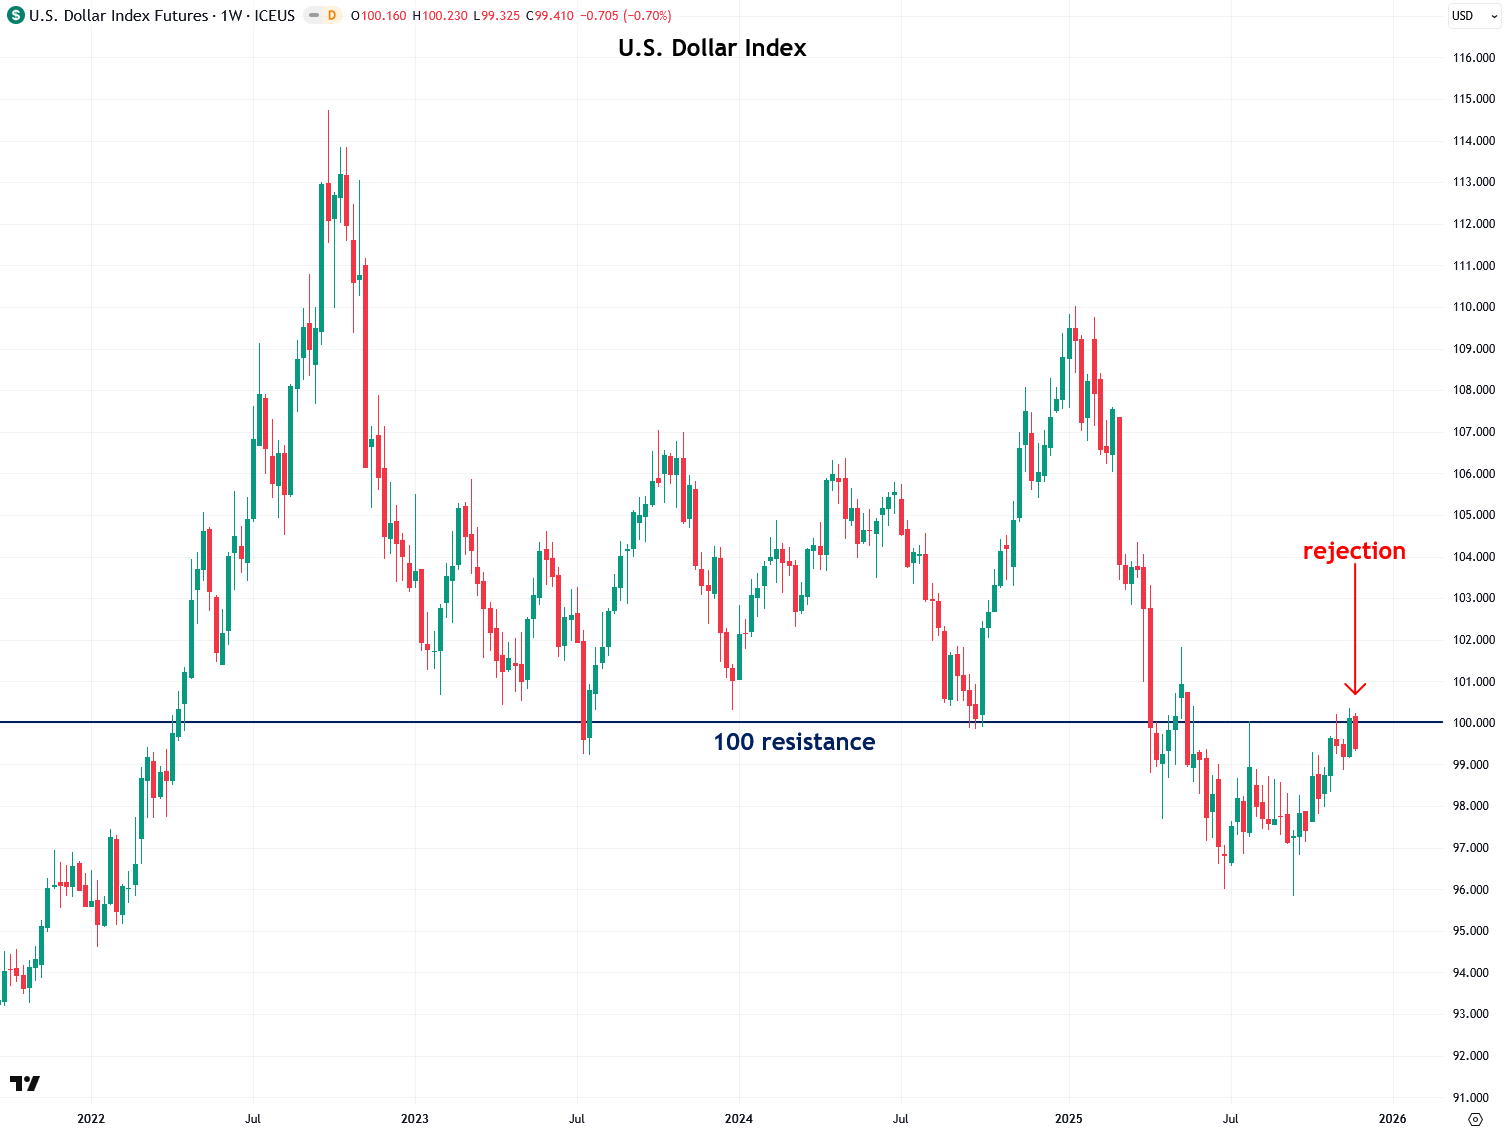
Another factor that may be about to give both copper and silver a huge boost is a possible bearish move in the U.S. Dollar Index, now that it is showing signs of bumping its head on the key 100 resistance level. The dollar and commodities have an inverse relationship, so bearish moves in the dollar are bullish for commodities and vice versa. Learn more about this possible scenario in my analysis from last week.
Copper’s recent rally has been driven by a series of positive catalysts. One of the most significant was a major disruption in early October at the Grasberg mine in Indonesia, which is the world’s second-largest source of copper, following a serious accident that Goldman Sachs referred to as a “black swan event.” Other bullish drivers include rising optimism around AI and electrification-related demand, growing expectations of U.S. interest rate cuts, and broad strength across the metals complex.
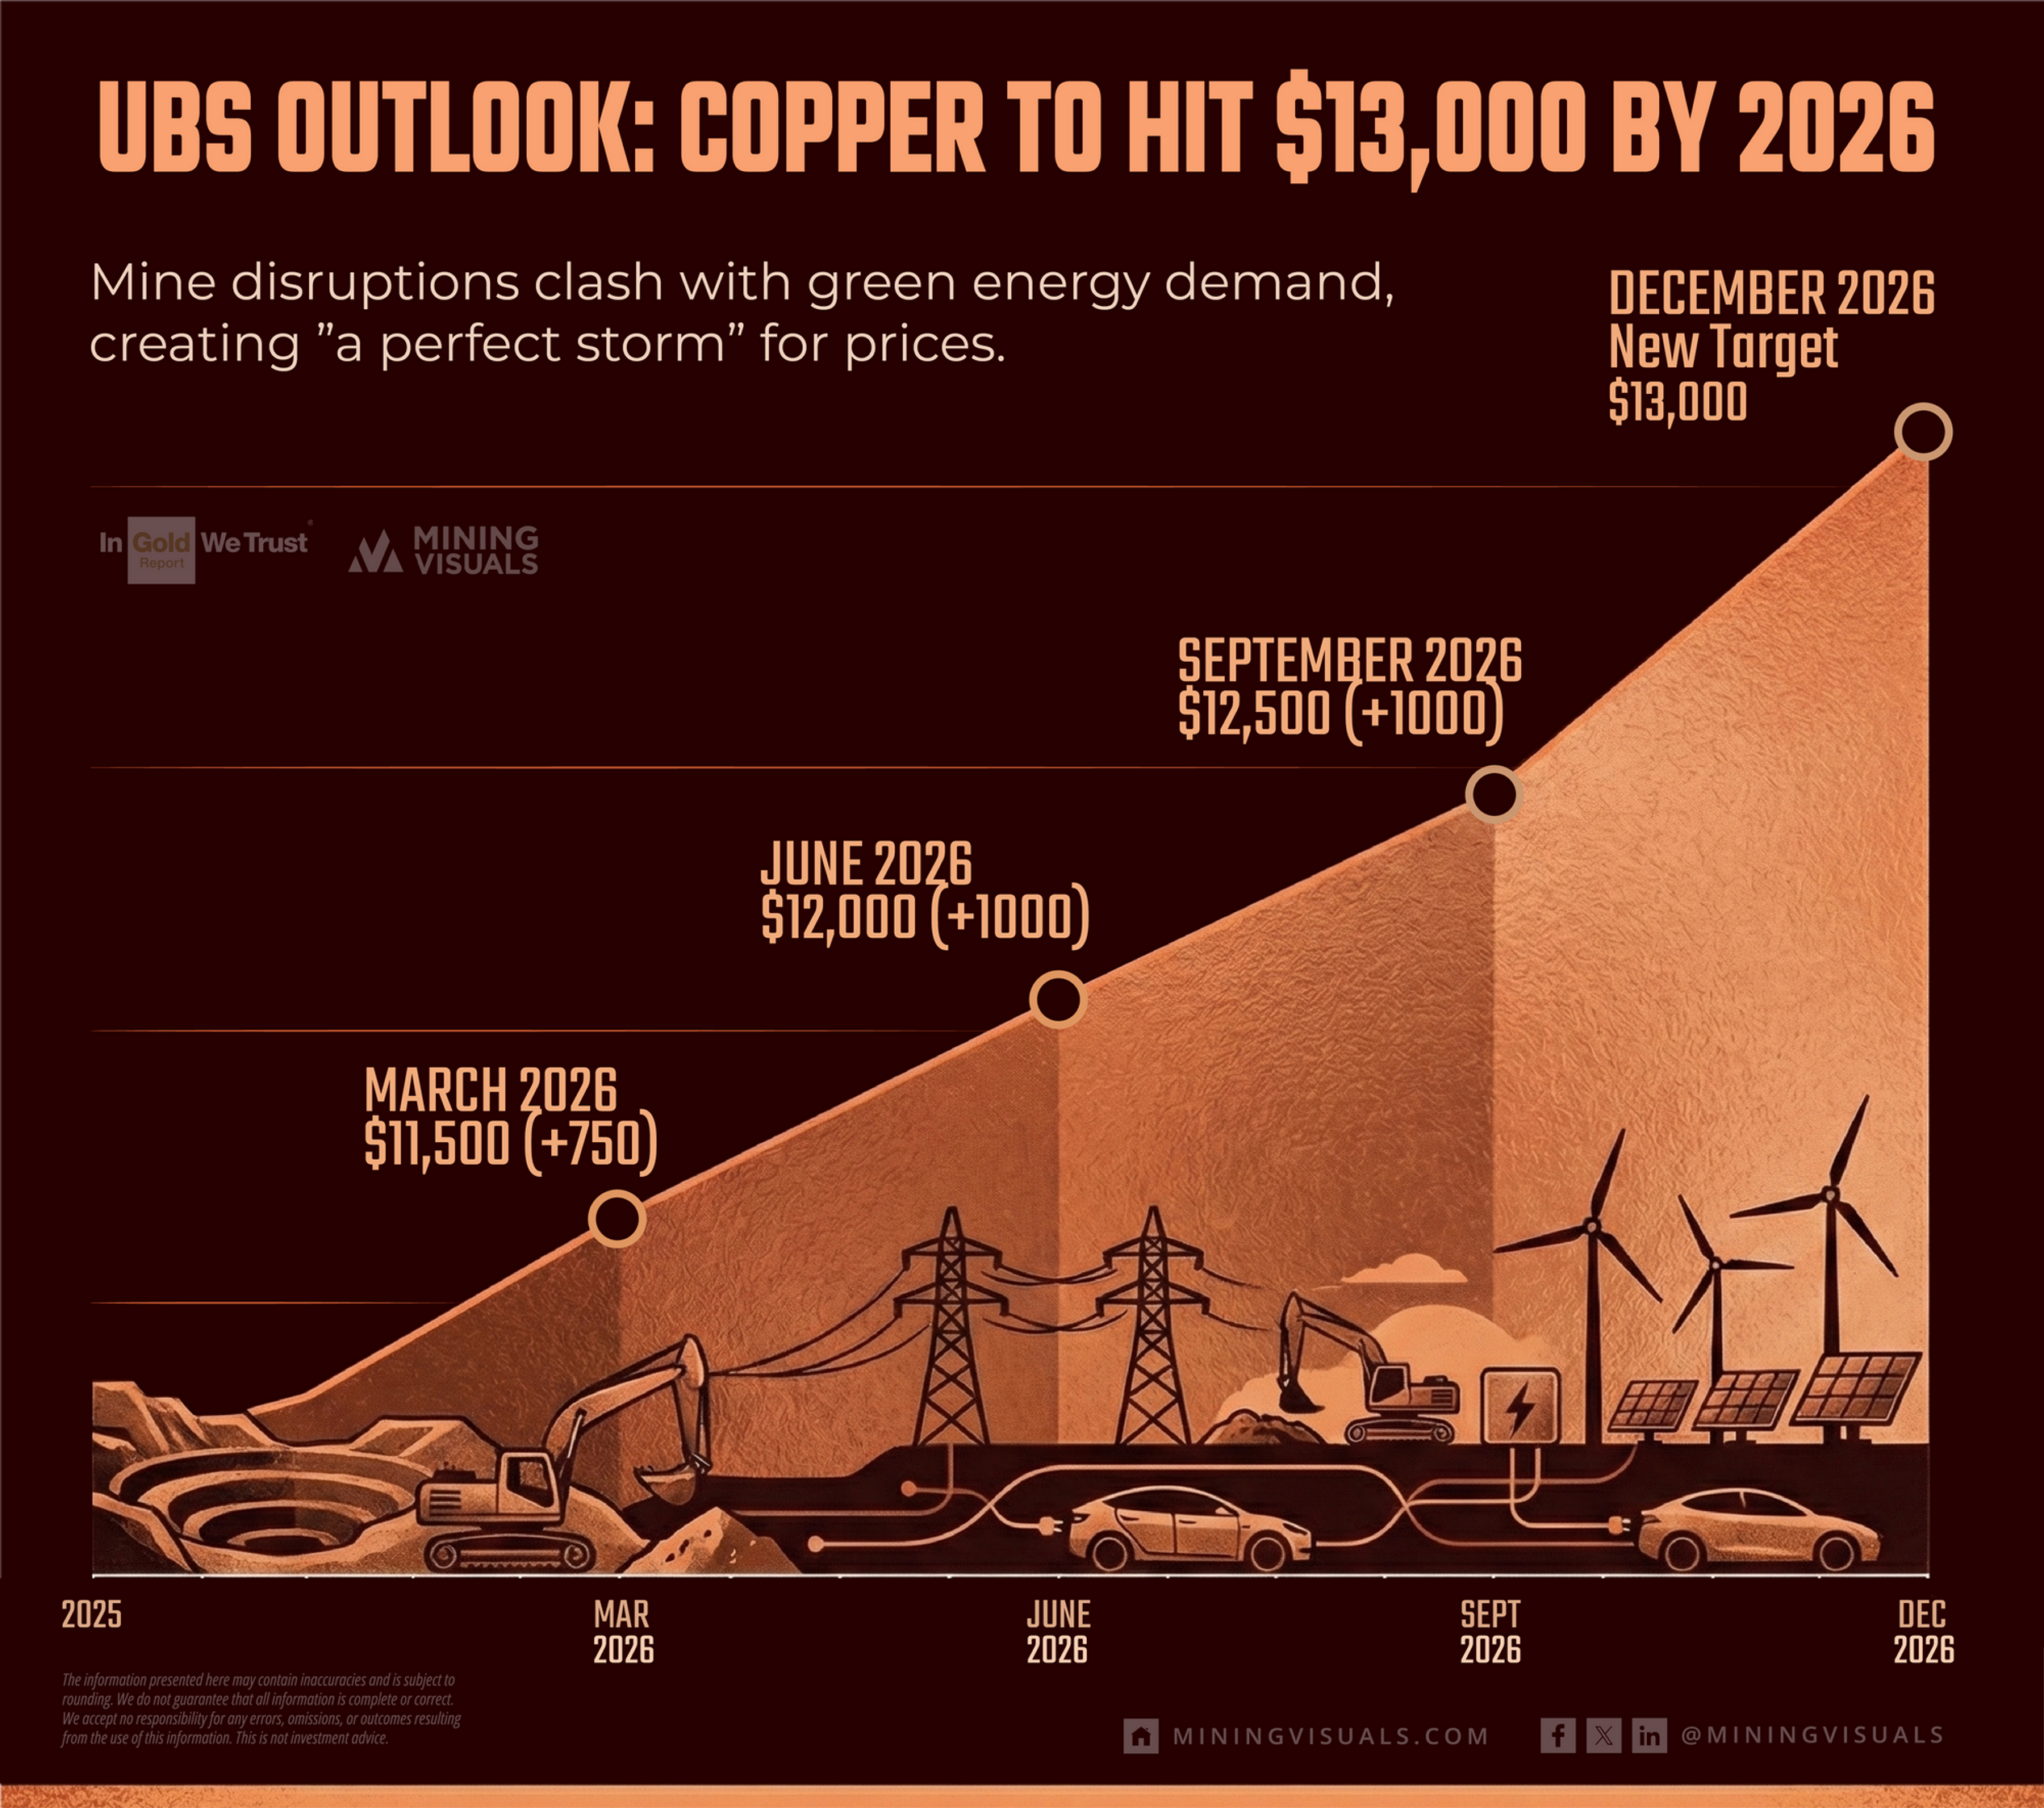
One of the recent bullish factors for copper came last week, when UBS raised its price forecast to $13,000 per tonne by December 2026, as shown in the infographic below from MiningVisuals:
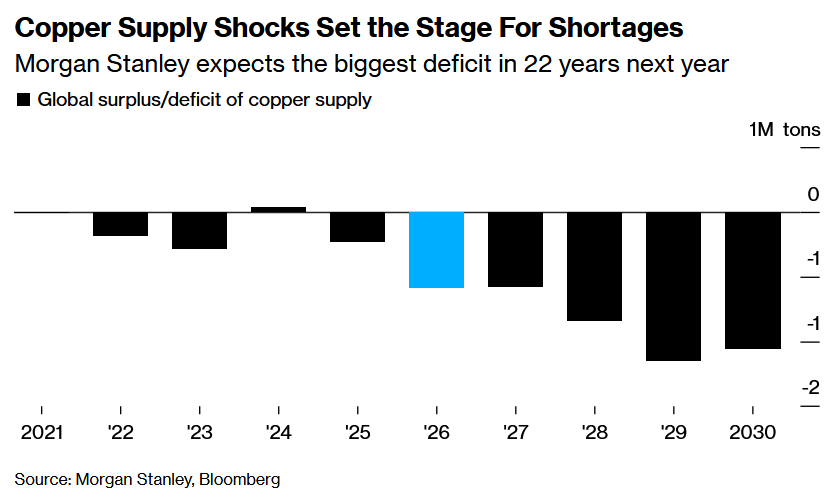
In addition, Morgan Stanley forecasts that the global copper market will face its most severe deficit in over 20 years by 2026, due to mine supply setbacks and tariff-driven trade disruptions, as reported in the Bloomberg article from which the chart below is sourced.
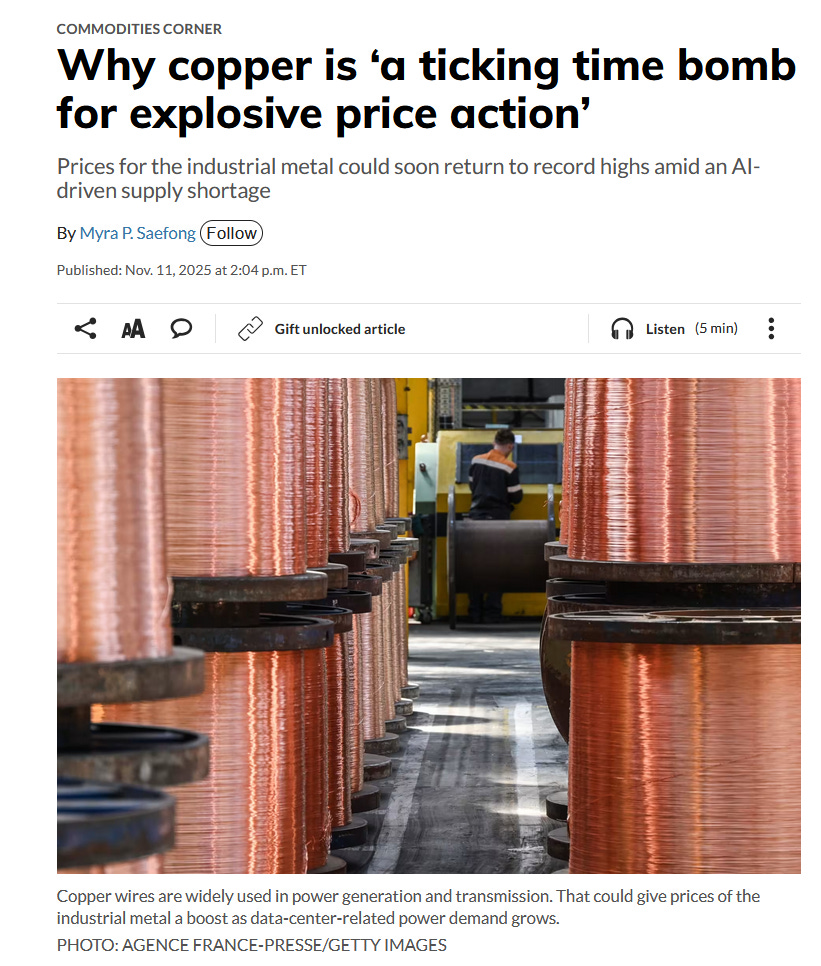
This looming supply shortage has led a recent MarketWatch article to describe copper as “a ticking time bomb for explosive price action,” which echoes what I have been consistently saying for over a year:
Now that I have reiterated my bullish case for copper, I want to shift to how an upcoming bull market in copper is likely to supercharge silver’s bull market. Copper and silver are highly correlated and linked through trading algorithms, with moves in copper frequently acting as catalysts for moves in silver, as I explained in this presentation. While many investors focus primarily on gold’s influence on silver, they should also be paying close attention to copper’s role.
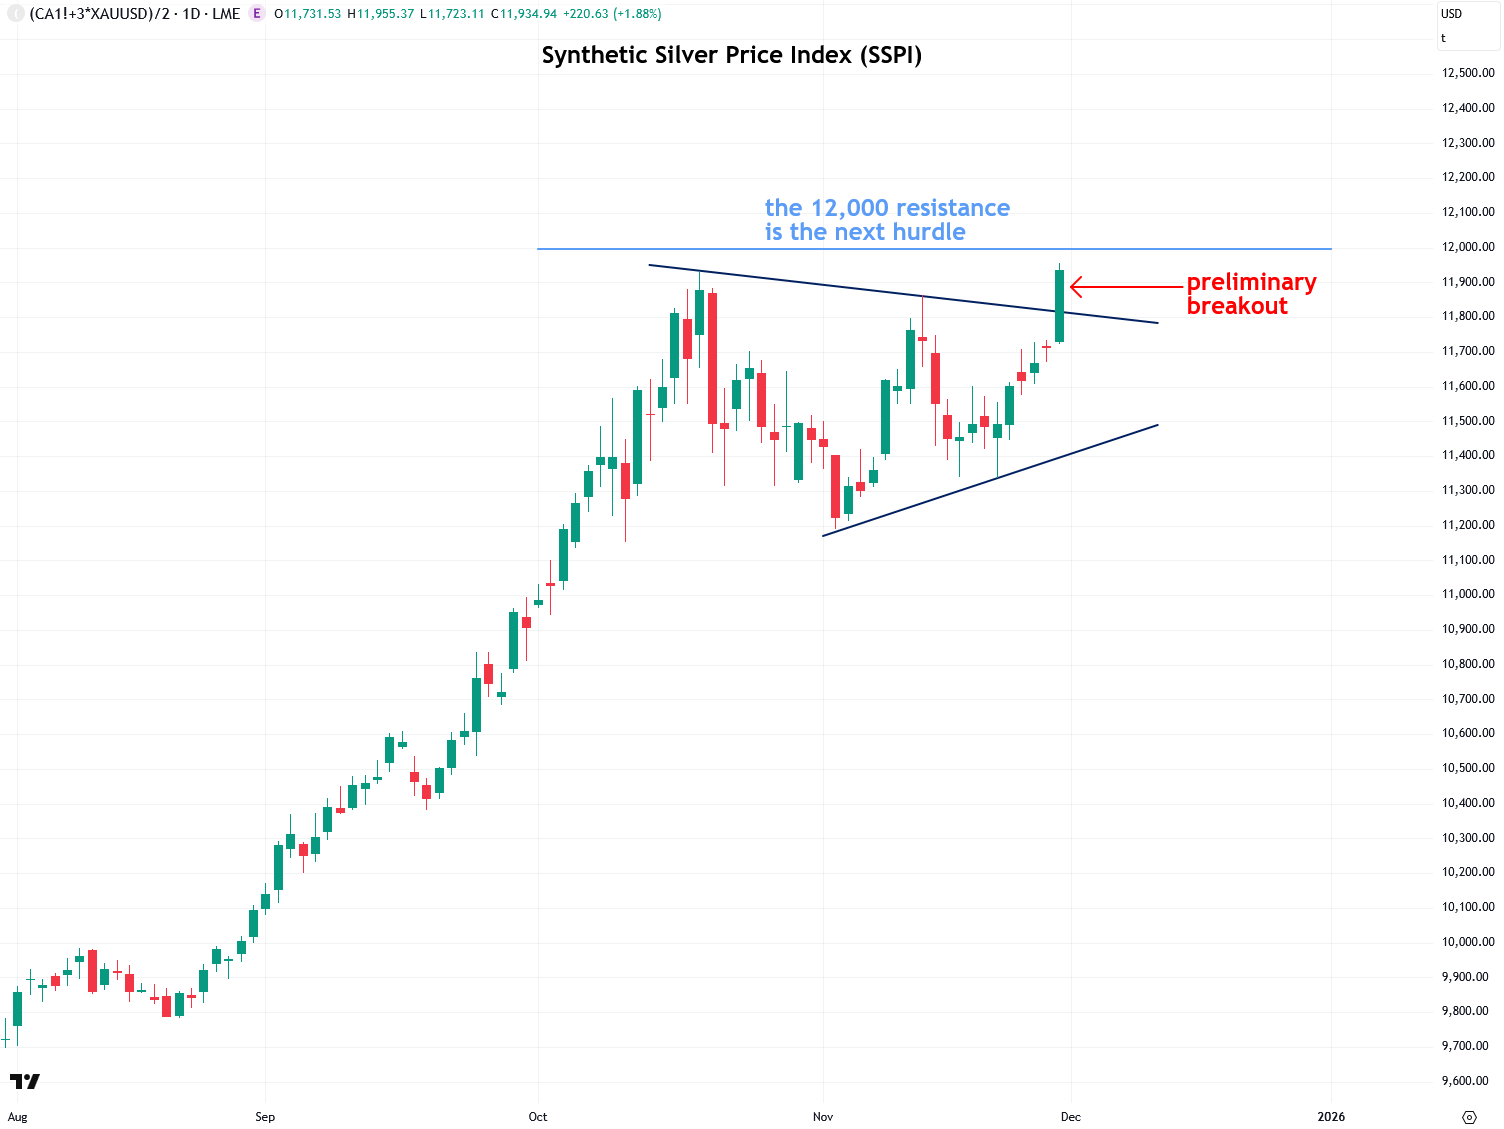
That insight is what led me to develop my proprietary indicator, the Synthetic Silver Price Index (SSPI), a valuable tool for assessing whether moves in silver are genuine or likely false signals engineered by bullion banks to mislead retail investors and traders. The SSPI is essentially an average of copper and gold prices, and I explained the methodology in greater detail in this tutorial.
Over the past month and a half, the SSPI formed a triangle pattern and, thanks to strength in both gold and copper, it broke out on Friday with a strong green candle, confirming silver’s breakout (learn more). Assuming copper enters the bull market I have outlined throughout this report, the SSPI will also move significantly higher. That would create increased bullish algorithmic “pressure,” so to speak, which would, in turn, help drive silver even higher.
To summarize, my consistently bullish stance on copper is being validated by both recent price action and news, with copper hitting a fresh all-time high on Friday. However, the move so far remains relatively weak and choppy compared to what I expect if copper breaks out of its ascending triangle on the monthly chart. When that breakout occurs, I believe copper will explode out of the gate and give silver’s bull market a significant boost, given their close relationship. Everything is aligning for this scenario, from the technicals to the fundamentals, and I believe some exciting times are ahead.
If you’ve enjoyed this report or have any questions, comments, or thoughts, please give this post a like and share your thoughts in the comments below—I’d love to start a conversation and hear your perspective.
Disclaimer: the information provided in The Bubble Bubble Report and related content is for informational and educational purposes only and should not be construed as investment, financial, or trading advice. Nothing in this publication constitutes a recommendation, solicitation, or offer to buy or sell any securities, commodities, or financial instruments.
All investments carry risk, and past performance is not indicative of future results. Readers should conduct their own research and consult with a qualified financial advisor before making any investment decisions. The author and publisher disclaim any liability for financial losses or damages incurred as a result of reliance on the information provided.