Michael A. Gayed, CFA
How To Interpret the Signals: Within each strategy, there is a risk-on and risk-off investment recommendation, with the risk-off option being the more conservative of the two. When a particular signal indicates that investors should be risk-off, for example, subscribers should consider investing in the risk-off option and avoiding the risk-on option. The opposite, therefore, would be true when the signal flips to risk-on. In each strategy, you’d always be invested in one option or the other.
Here’s how to read the scorecard for each strategy:

Some of the strategies will be more aggressive than others. The “Leverage For The Long Run” strategy, for example, uses the S&P 500 and 2x-leveraged S&P 500. The more conservative “Lumber/Gold Bond” strategy, however, uses intermediate-term Treasuries and the S&P 500. In every case, a risk-off signal indicates that you should be invested in the more conservative of the two options, while a risk-on signal indicates you should be invested in the more aggressive one.
For a full user’s guide on how to interpret each of the signals and how to put them to work in your portfolio, please click HERE.
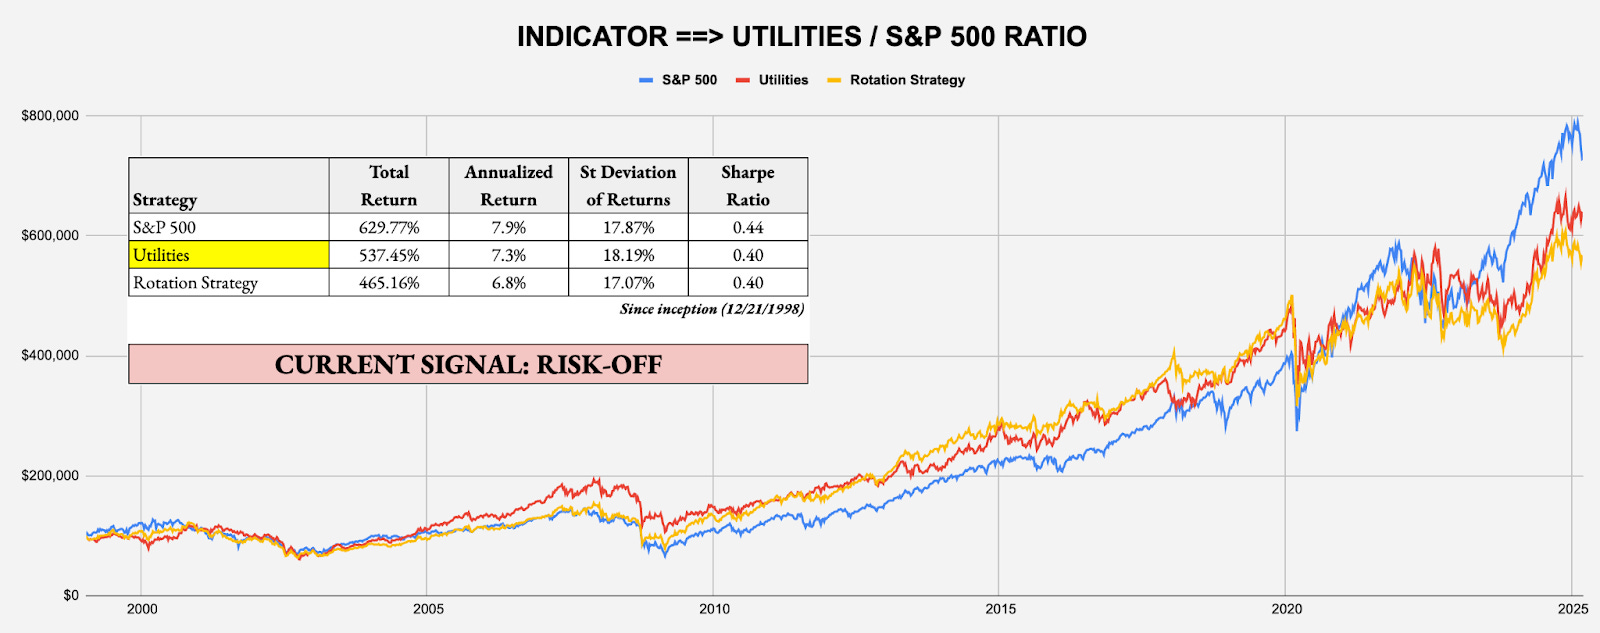
SHORT-TERM SIGNAL: UTILITIES/S&P 500 RATIO
Target Investor: Short-term traders with a higher risk tolerance interested in using an equity momentum strategy to anticipate changes in market risk tolerance.
Current Indicator: Risk-Off
Strategy: Beta Rotation – Example: Invest in Utilities (XLU) over S&P 500 (SPY)
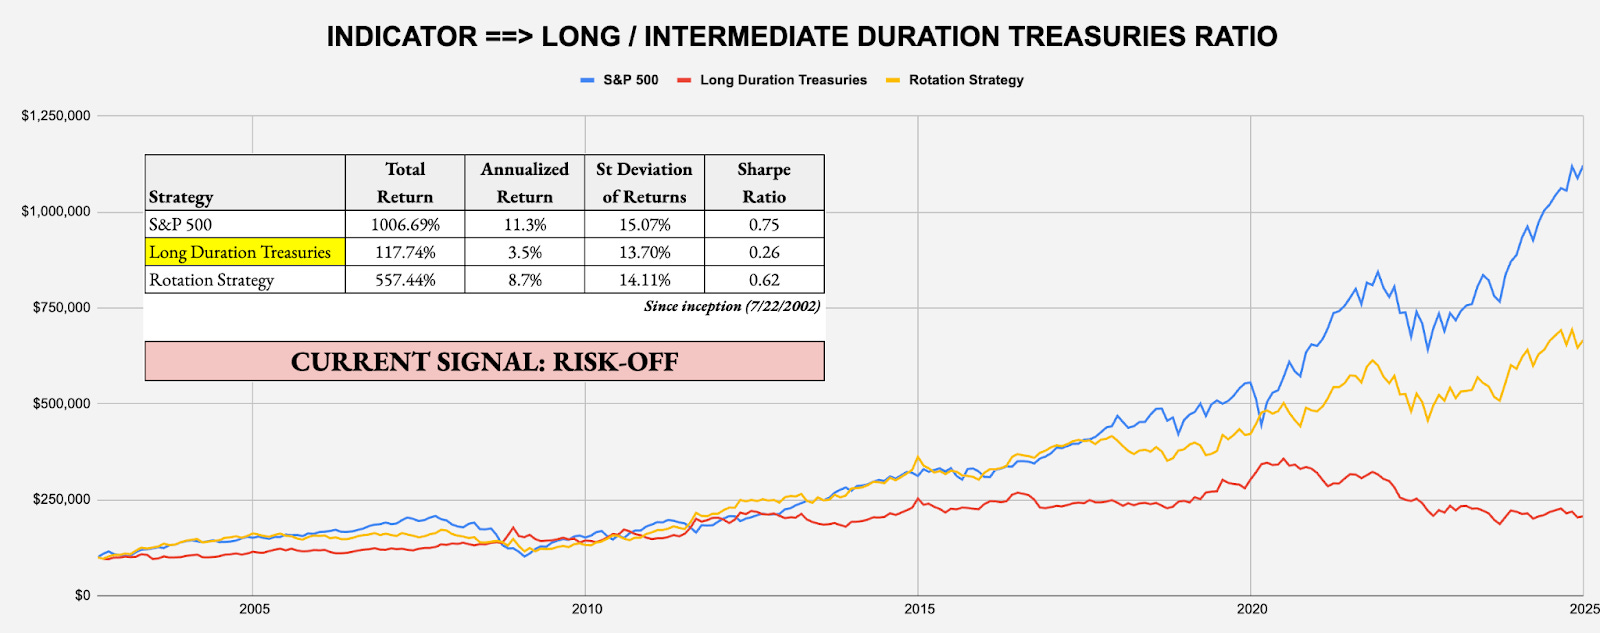
SHORT-TERM SIGNAL: LONG DURATION/INTERMEDIATE DURATION TREASURIES RATIO
Target Investor: Short-term traders with a higher risk tolerance who want to use the activity in the U.S. Treasury market to judge overall risk levels.
Current Indicator: Risk-Off
Strategy: Tactical Risk Rotation – Example: Invest in Long-Duration Treasuries (VLGSX) over S&P 500 (SPY)
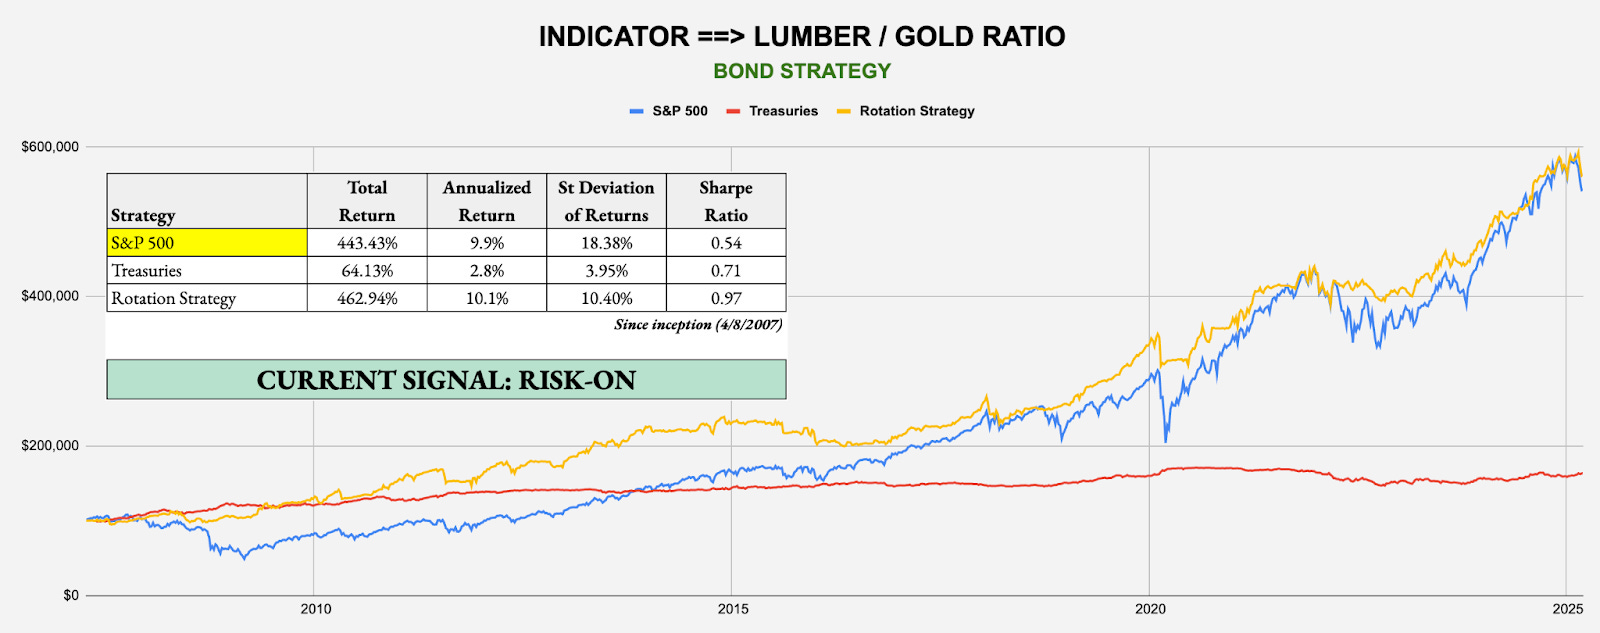
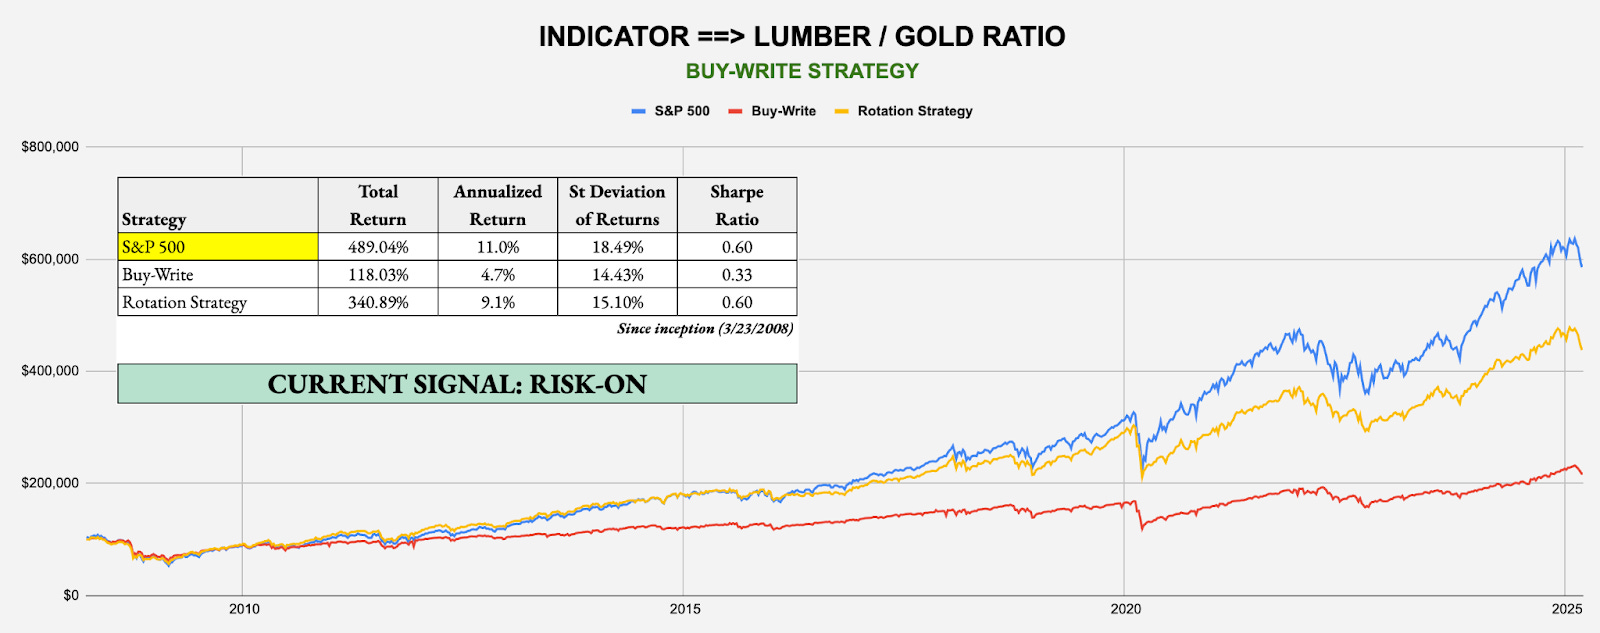
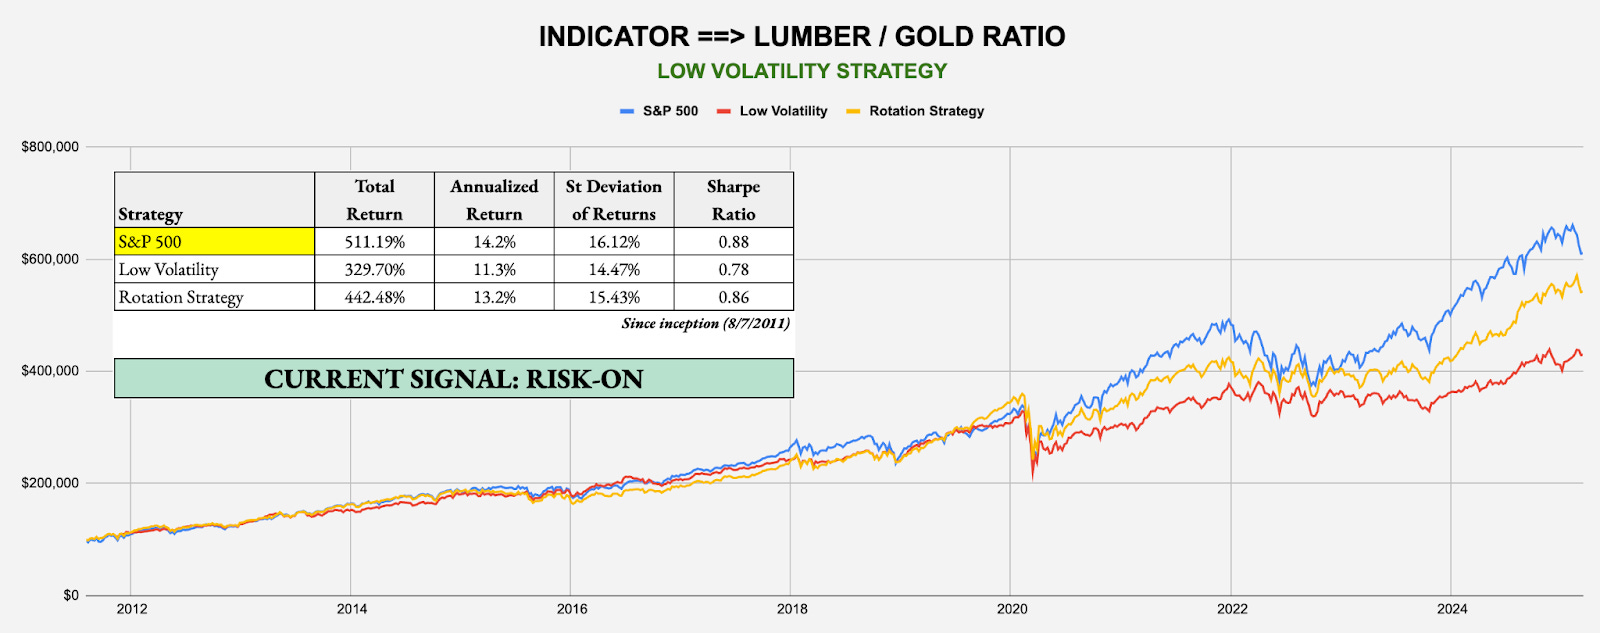
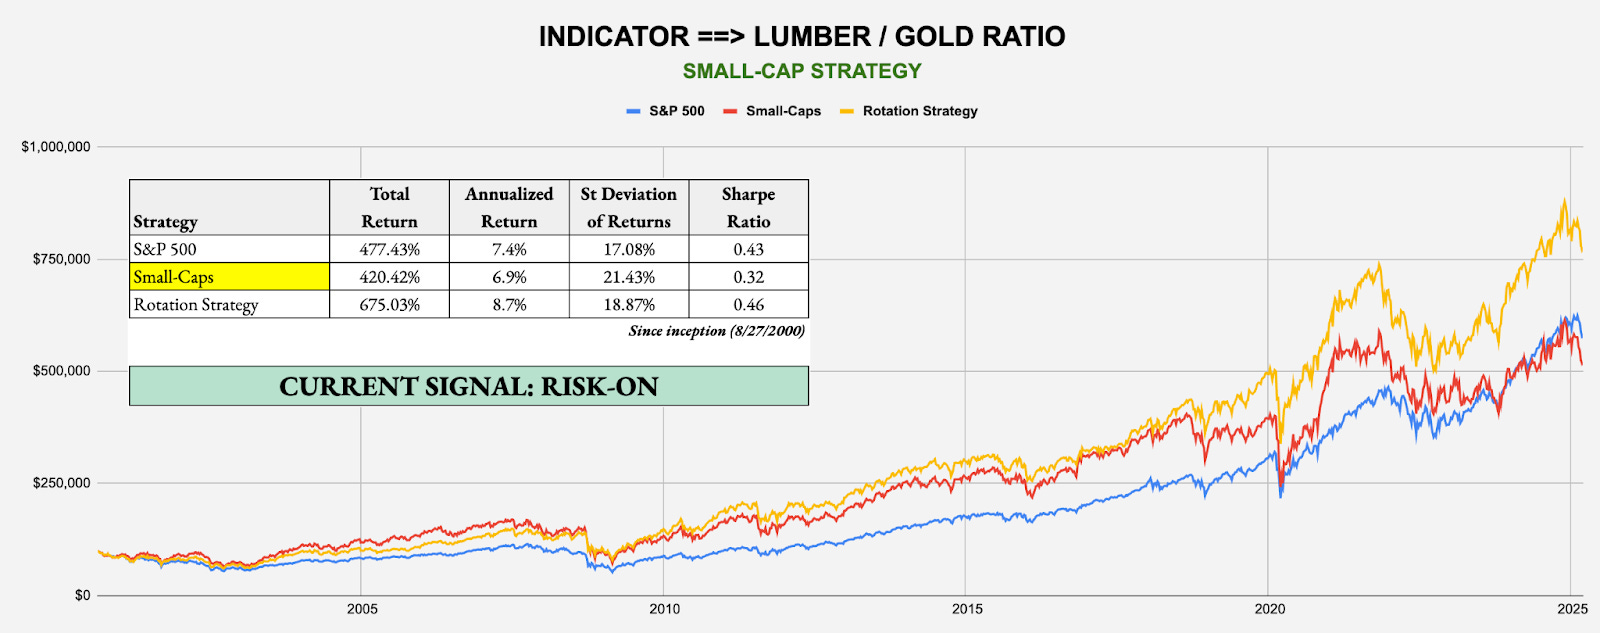
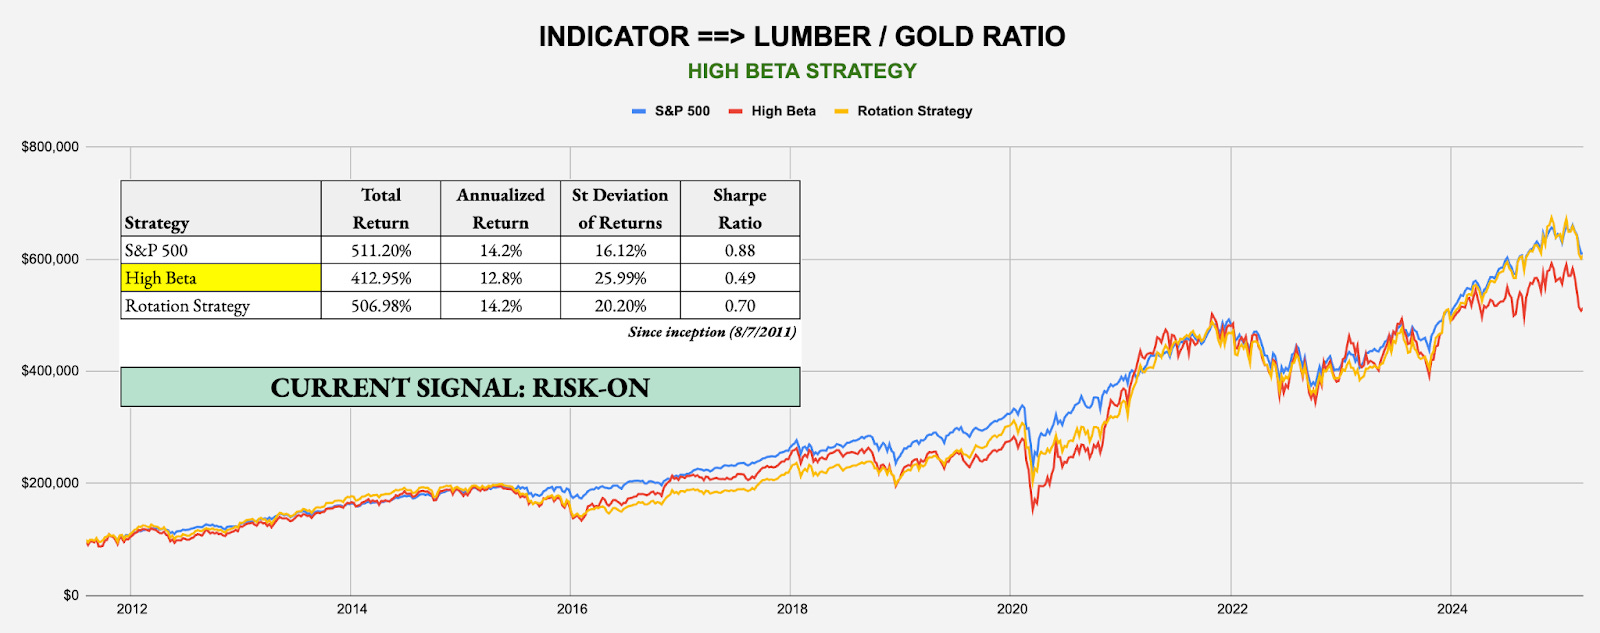
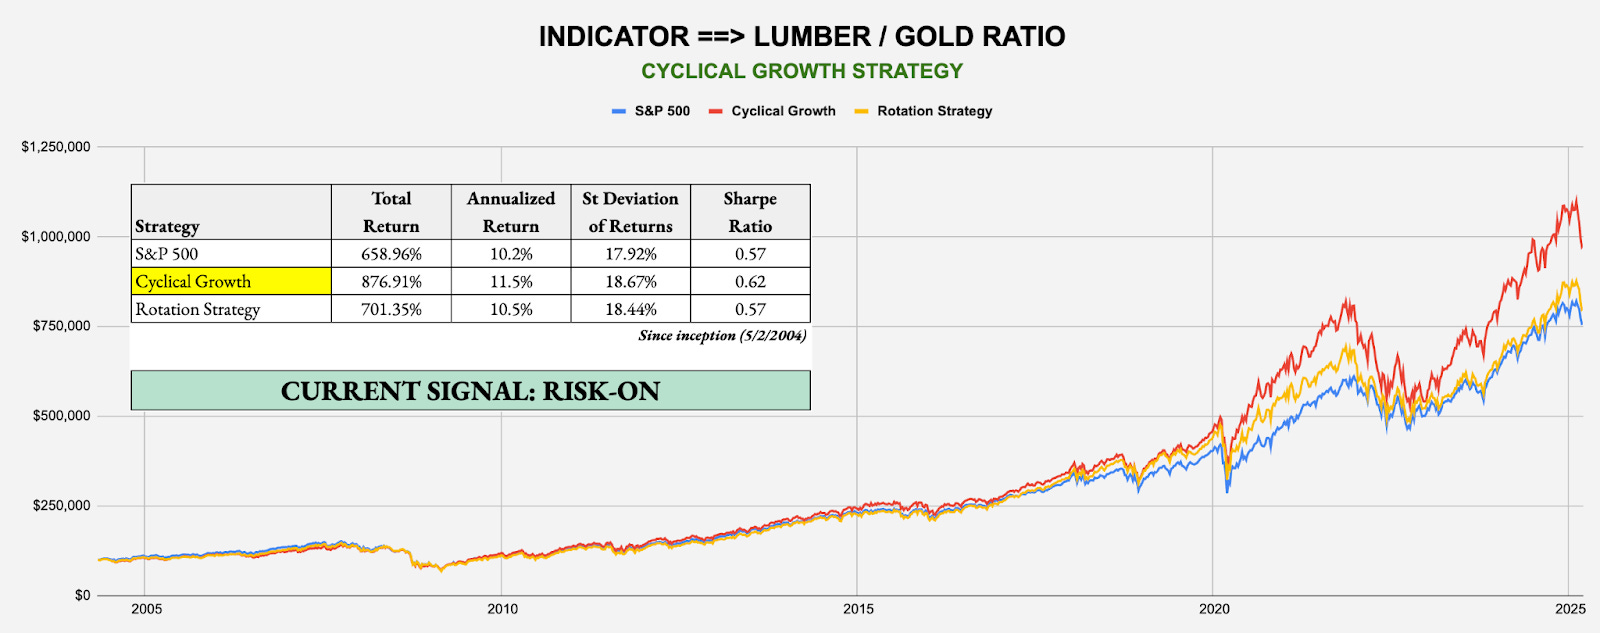
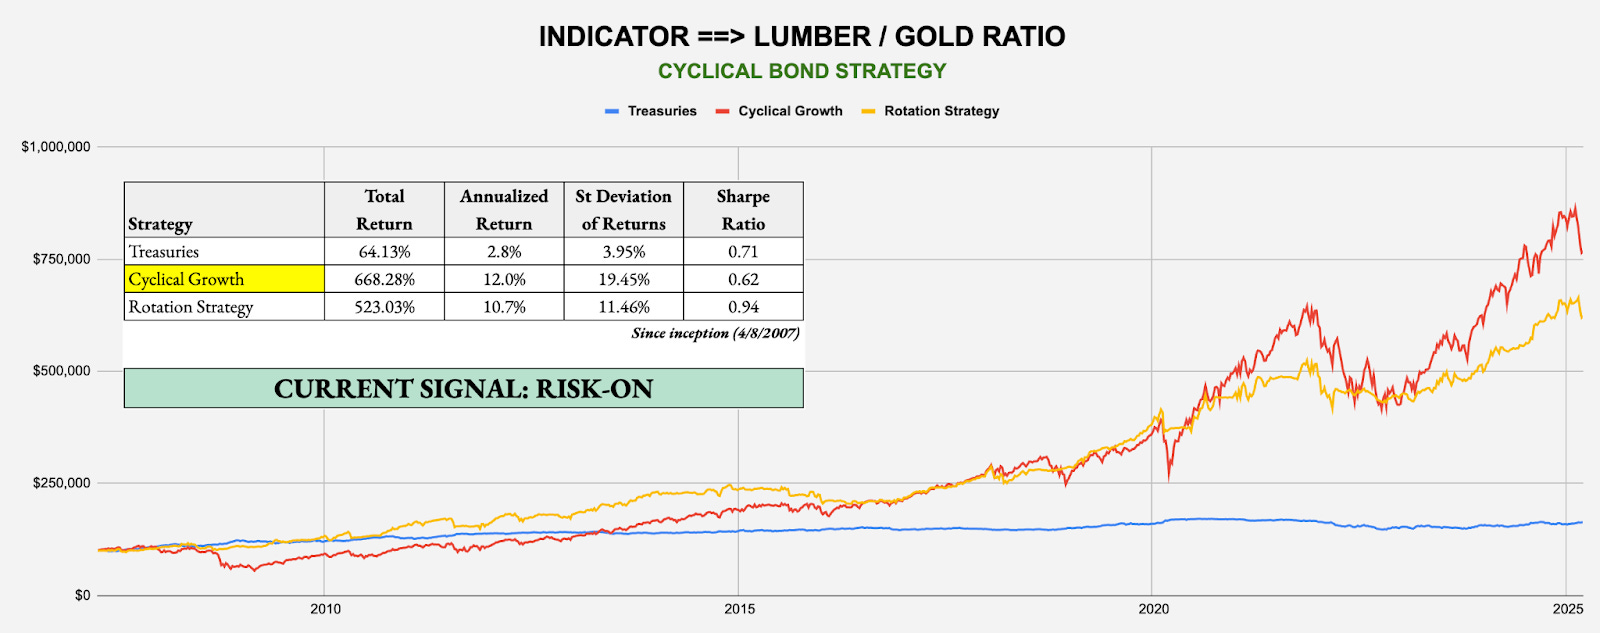
INTERMEDIATE-TERM SIGNAL: LUMBER/GOLD RATIO
Target Investor: Short- and long-term investors willing to trade more frequently using the classic cyclical vs. defensive asset comparison.
Current Indicator: Risk-On
Strategy: Lumber/Gold Bond – Example: Invest in S&P 500 (SPY) over Treasuries (GOVT)
Strategy: Lumber/Gold Buy-Write – Example: Invest in S&P 500 (SPY) over Buy-Write (PBP)
Strategy: Lumber/Gold Low Volatility – Example: Invest in S&P 500 (SPY) over Low Volatility (SPLV)
Strategy: Lumber/Gold Small-Cap – Example: Invest in Small-Caps (VSMAX) over Large-Caps (SPY)
Strategy: Lumber/Gold High Beta – Example: Invest in High Beta (SPHB) over S&P 500 (SPY)
Strategy: Lumber/Gold Cyclical Growth – Example: Invest in Growth (VUG) over S&P 500 (SPY)
Strategy: Lumber/Gold Cyclical Bond – Example: Invest in Growth (VUG) over Treasuries (GOVT)
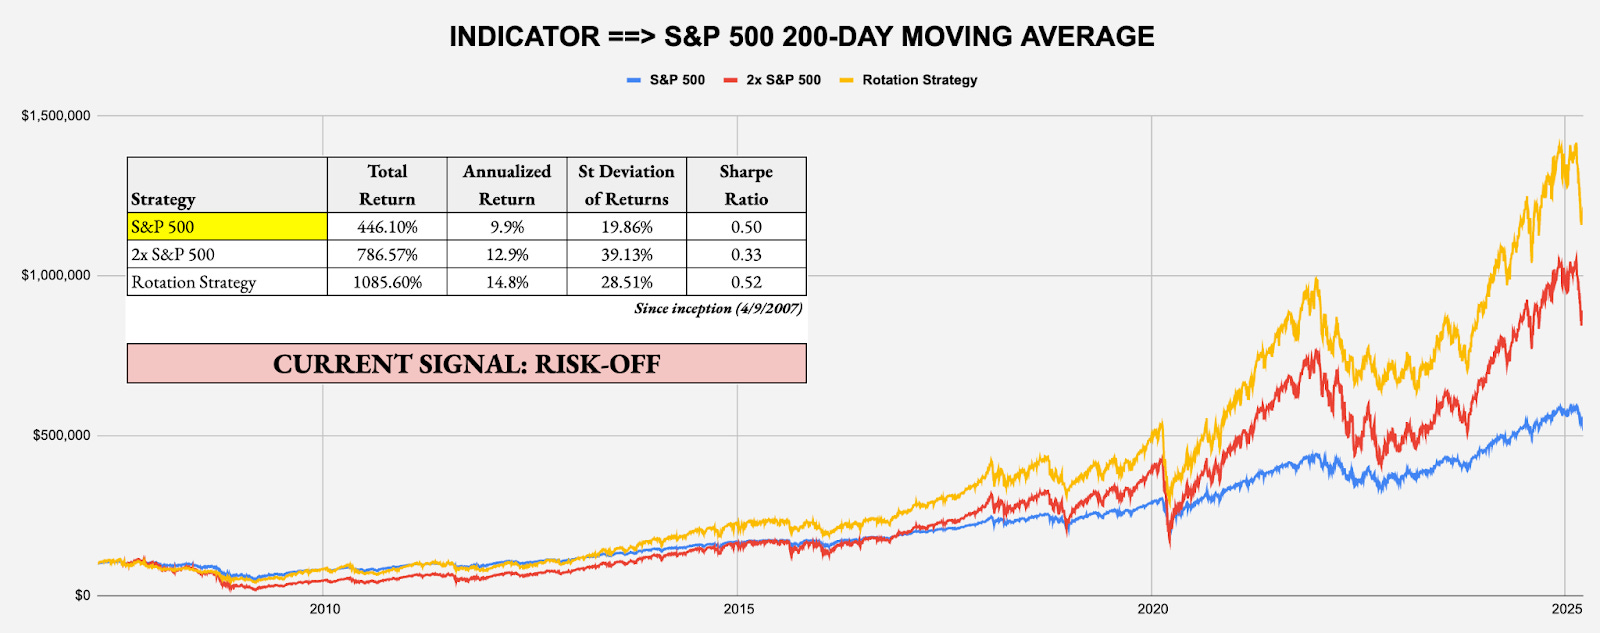
LONG-TERM SIGNAL: S&P 500 200-DAY MOVING AVERAGE
Target Investor: Long-term investors with a higher risk tolerance willing to move to an aggressive strategy when the signal flips to risk-on.
Current Indicator: Risk-Off
Strategy: Leverage For The Long Run – Example: Invest in S&P 500 (SPY) over 2x-Leveraged S&P 500 (SSO)
About the Signals: The above trade signals and allocations are taken directly from each of the four award winning white papers I authored, which can be individually read at https://papers.ssrn.com/sol3/cf_dev/AbsByAuth.cfm?per_id=2224980. The underlying commonality across all risk-on/off signals and backtested strategies from these papers is the same: what matters isn’t being up more, but rather being down less. Each strategy historically has significantly outperformed through the avoidance of major drawdowns and volatile periods. The signals can change often from week to week, so it’s important to keep checking The Lead-Lag Report for updates. While not every trade and not every signal will be right, cumulatively over time, the identification of conditions that favor an accident in the stock market can help you slow down entering the storm, even if no one knows the exact mile marker where a crash might occur.
CONCLUSION
The markets appear to be balancing back out after several weeks of firm risk-off leadership. It’s not necessarily tech & growth that investors are migrating back to though. It’s cyclicals.
Financials, industrials and energy were the big winners on the week as Trump floated the idea of some flexibility on tariffs. The VIX closed back below 20 for the first time since late February, but it may be of little solace to a market that’s still dealing with a fair amount of uncertainty and unknowns. Trade policy rhetoric is still changing almost daily and the possibility of a shrinking economy in Q1 is weighing heavily.
The Fed held rates steady, as expected, and is still taking a wait and see approach on tariffs. Whether that’s the correct approach or not remains to be seen, but it’s waiting that has gotten the Fed into trouble in the past. The decision to dial back on QT is an indication that the central bank is worried more about slowing growth than inflation right now. I think that’s probably the correct viewpoint to take.
In my opinion, stocks are poised for a brief run-up as the dips get bought and investors eventually start to feel more comfortable with (or numb from) the current trade uncertainty. High yield spreads have begun contracting again even though stock prices were only modestly higher on the week. That’s usually indicative of sentiment turning higher, which is favorable as a short-term catalyst.
